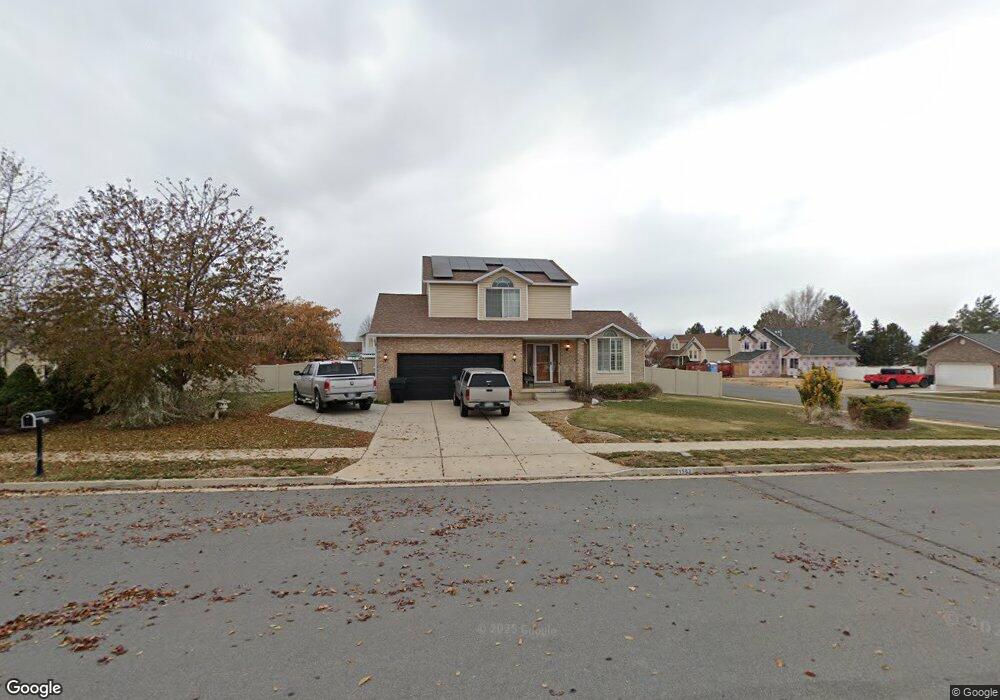
1503 N 1825 W Clinton, UT 84015
Estimated Value: $514,000 - $549,000
4
Beds
4
Baths
2,796
Sq Ft
$189/Sq Ft
Est. Value
About This Home
This home is located at 1503 N 1825 W, Clinton, UT 84015 and is currently estimated at $529,051, approximately $189 per square foot. 1503 N 1825 W is a home located in Davis County with nearby schools including Parkside Elementary School, West Point Junior High School, and Clearfield High School.
Ownership History
Date
Name
Owned For
Owner Type
Purchase Details
Closed on
Sep 28, 2021
Sold by
Bath Chad W
Bought by
Bath Chad W
Current Estimated Value
Home Financials for this Owner
Home Financials are based on the most recent Mortgage that was taken out on this home.
Original Mortgage
$377,500
Outstanding Balance
$344,954
Interest Rate
3.09%
Mortgage Type
New Conventional
Estimated Equity
$184,097
Purchase Details
Closed on
Feb 4, 2014
Sold by
Owens Henry L and Owens Colletta Maria
Bought by
Bath Chad W
Home Financials for this Owner
Home Financials are based on the most recent Mortgage that was taken out on this home.
Original Mortgage
$215,033
Interest Rate
4.25%
Mortgage Type
FHA
Create a Home Valuation Report for This Property
The Home Valuation Report is an in-depth analysis detailing your home's value as well as a comparison with similar homes in the area
Home Values in the Area
Average Home Value in this Area
Purchase History
| Date | Buyer | Sale Price | Title Company |
|---|---|---|---|
| Bath Chad W | -- | Placer Title Agency | |
| Bath Chad W | -- | First American Title |
Source: Public Records
Mortgage History
| Date | Status | Borrower | Loan Amount |
|---|---|---|---|
| Open | Bath Chad W | $377,500 | |
| Closed | Bath Chad W | $215,033 |
Source: Public Records
Tax History Compared to Growth
Tax History
| Year | Tax Paid | Tax Assessment Tax Assessment Total Assessment is a certain percentage of the fair market value that is determined by local assessors to be the total taxable value of land and additions on the property. | Land | Improvement |
|---|---|---|---|---|
| 2025 | $2,831 | $272,250 | $102,781 | $169,469 |
| 2024 | $2,714 | $262,350 | $111,087 | $151,263 |
| 2023 | $2,566 | $459,000 | $129,718 | $329,282 |
| 2022 | $2,730 | $270,050 | $75,331 | $194,719 |
| 2021 | $2,460 | $361,000 | $101,162 | $259,838 |
| 2020 | $2,148 | $312,000 | $89,803 | $222,197 |
| 2019 | $2,100 | $298,000 | $97,906 | $200,094 |
| 2018 | $1,965 | $274,000 | $81,814 | $192,186 |
| 2016 | $1,842 | $132,605 | $32,628 | $99,977 |
| 2015 | $1,804 | $123,475 | $32,628 | $90,847 |
| 2014 | $1,872 | $130,177 | $32,628 | $97,549 |
| 2013 | -- | $133,567 | $32,116 | $101,451 |
Source: Public Records
Map
Nearby Homes