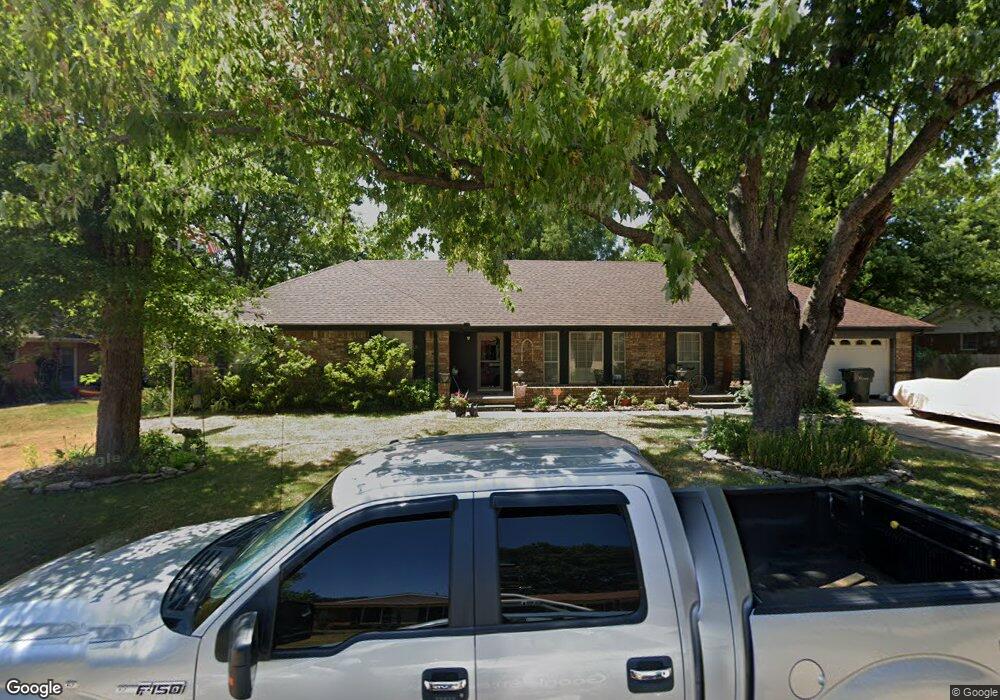
1503 N Choctaw Place Claremore, OK 74017
Estimated Value: $240,258 - $289,000
3
Beds
2
Baths
2,124
Sq Ft
$125/Sq Ft
Est. Value
About This Home
This home is located at 1503 N Choctaw Place, Claremore, OK 74017 and is currently estimated at $264,815, approximately $124 per square foot. 1503 N Choctaw Place is a home located in Rogers County with nearby schools including Roosa Elementary School, Will Rogers Junior High School, and Claremore High School.
Ownership History
Date
Name
Owned For
Owner Type
Purchase Details
Closed on
Nov 19, 2007
Sold by
Johnson Stephen R
Bought by
Rupe Darrel L and Rupe Delaine
Current Estimated Value
Home Financials for this Owner
Home Financials are based on the most recent Mortgage that was taken out on this home.
Original Mortgage
$103,500
Outstanding Balance
$65,188
Interest Rate
6.38%
Mortgage Type
New Conventional
Estimated Equity
$199,627
Purchase Details
Closed on
Aug 26, 2005
Sold by
Poyner Cynthia L and Johnson Cynthia L
Bought by
Johnson Stephen R
Home Financials for this Owner
Home Financials are based on the most recent Mortgage that was taken out on this home.
Original Mortgage
$50,400
Interest Rate
6.41%
Mortgage Type
Purchase Money Mortgage
Purchase Details
Closed on
Nov 7, 2003
Sold by
Johnson Raymond L
Create a Home Valuation Report for This Property
The Home Valuation Report is an in-depth analysis detailing your home's value as well as a comparison with similar homes in the area
Home Values in the Area
Average Home Value in this Area
Purchase History
| Date | Buyer | Sale Price | Title Company |
|---|---|---|---|
| Rupe Darrel L | $138,000 | Land Title Closing Services | |
| Johnson Stephen R | -- | None Available | |
| -- | -- | -- |
Source: Public Records
Mortgage History
| Date | Status | Borrower | Loan Amount |
|---|---|---|---|
| Open | Rupe Darrel L | $103,500 | |
| Previous Owner | Johnson Stephen R | $50,400 |
Source: Public Records
Tax History Compared to Growth
Tax History
| Year | Tax Paid | Tax Assessment Tax Assessment Total Assessment is a certain percentage of the fair market value that is determined by local assessors to be the total taxable value of land and additions on the property. | Land | Improvement |
|---|---|---|---|---|
| 2025 | $1,489 | $17,620 | $4,032 | $13,588 |
| 2024 | $1,489 | $17,107 | $3,914 | $13,193 |
| 2023 | $1,489 | $16,609 | $3,672 | $12,937 |
| 2022 | $1,400 | $16,125 | $3,300 | $12,825 |
| 2021 | $1,369 | $16,502 | $3,300 | $13,202 |
| 2020 | $1,419 | $16,646 | $3,300 | $13,346 |
| 2019 | $1,390 | $16,012 | $3,300 | $12,712 |
| 2018 | $1,468 | $16,891 | $3,300 | $13,591 |
| 2017 | $1,447 | $16,757 | $3,300 | $13,457 |
| 2016 | $1,442 | $16,360 | $3,300 | $13,060 |
| 2015 | $1,412 | $16,223 | $3,300 | $12,923 |
| 2014 | $1,402 | $16,122 | $3,300 | $12,822 |
Source: Public Records
Map
Nearby Homes
- 1411 N Choctaw Place
- 326 E 15th St
- 1335 N Mcfarland Place
- 305 E Falletti Ave
- 103 E 12th Place
- 1216 N Sioux Ave
- 401 W Blue Starr Dr
- 804 E Park St
- 419 E 12th St
- 1119 N Oklahoma Ave
- 0 N J M Davis Blvd
- 1805 NE Oakridge Dr
- 119 N Missouri Ave
- 1012 N Osage Ave
- 1119 N Kansas Ave
- 104 W 7th St
- 1027 N Miller Dr
- 802 W 23rd Place N Unit A&B
- 2403 N Jay St
- 902 W 8th St
- 1505 N Choctaw Place
- 1501 N Choctaw Place
- 1504 N Choctaw Ave
- 1504 N Choctaw Place
- 1506 N Choctaw Place
- 1502 N Choctaw Ave
- 1506 N Choctaw Ave
- 1506 S Choctaw Ave
- 1502 N Choctaw Place
- 1507 N Choctaw Place
- 1505 N Louisville Ave
- 1508 N Choctaw Ave
- 1508 N Choctaw Place
- 1507 N Louisville Ave
- 1412 N Choctaw Ave
- 1412 N Choctaw Place
- 1503 N Choctaw Ave
- 1501 N Choctaw Ave
- 1505 N Choctaw Ave
- 1509 N Choctaw Place