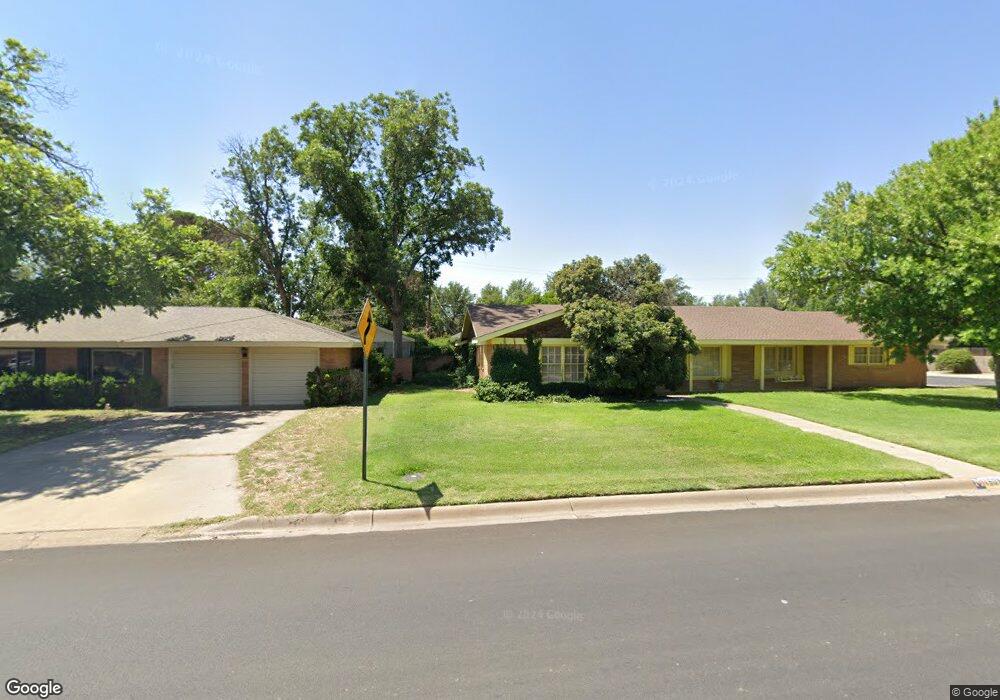
1503 Neely Ave Midland, TX 79705
Estimated Value: $338,000 - $390,000
3
Beds
2
Baths
2,087
Sq Ft
$177/Sq Ft
Est. Value
About This Home
This home is located at 1503 Neely Ave, Midland, TX 79705 and is currently estimated at $369,051, approximately $176 per square foot. 1503 Neely Ave is a home located in Midland County with nearby schools including Fannin Elementary School, Midland High School, and The Hillander School.
Ownership History
Date
Name
Owned For
Owner Type
Purchase Details
Closed on
Oct 21, 2022
Sold by
Alexander Rachel
Bought by
Carrasco Rigoberto V and Carrasco Pamela
Current Estimated Value
Purchase Details
Closed on
Sep 13, 2007
Sold by
Dukes Eleanor Y
Bought by
Spears Brenda A
Purchase Details
Closed on
Feb 17, 2006
Sold by
Jones Rickey L and Jones Billye J
Bought by
Dukes Eleanor Y
Home Financials for this Owner
Home Financials are based on the most recent Mortgage that was taken out on this home.
Original Mortgage
$127,877
Interest Rate
6.1%
Mortgage Type
Purchase Money Mortgage
Purchase Details
Closed on
Sep 29, 1999
Sold by
Masters J W
Bought by
Spears Brenda A
Purchase Details
Closed on
Nov 5, 1981
Bought by
Spears Brenda A
Create a Home Valuation Report for This Property
The Home Valuation Report is an in-depth analysis detailing your home's value as well as a comparison with similar homes in the area
Home Values in the Area
Average Home Value in this Area
Purchase History
| Date | Buyer | Sale Price | Title Company |
|---|---|---|---|
| Carrasco Rigoberto V | -- | West Texas Abstract & Title | |
| Spears Brenda A | -- | -- | |
| Dukes Eleanor Y | -- | None Available | |
| Spears Brenda A | -- | -- | |
| Spears Brenda A | -- | -- |
Source: Public Records
Mortgage History
| Date | Status | Borrower | Loan Amount |
|---|---|---|---|
| Previous Owner | Dukes Eleanor Y | $127,877 |
Source: Public Records
Tax History Compared to Growth
Tax History
| Year | Tax Paid | Tax Assessment Tax Assessment Total Assessment is a certain percentage of the fair market value that is determined by local assessors to be the total taxable value of land and additions on the property. | Land | Improvement |
|---|---|---|---|---|
| 2025 | $5,239 | $334,290 | $29,070 | $305,220 |
| 2024 | $5,246 | $345,460 | $29,070 | $316,390 |
| 2023 | $5,403 | $360,540 | $29,070 | $331,470 |
| 2022 | $5,336 | $345,900 | $29,070 | $316,830 |
| 2021 | $5,409 | $341,490 | $29,070 | $312,420 |
| 2020 | $2,712 | $282,270 | $29,070 | $253,200 |
| 2019 | $4,995 | $263,860 | $29,070 | $253,200 |
| 2018 | $4,664 | $239,870 | $29,070 | $243,570 |
| 2017 | $4,240 | $218,060 | $29,070 | $208,470 |
| 2016 | $3,861 | $198,240 | $29,070 | $206,560 |
| 2015 | -- | $180,220 | $29,070 | $206,560 |
| 2014 | -- | $168,910 | $29,070 | $139,840 |
Source: Public Records
Map
Nearby Homes
- 1611 W Pecan Ave
- 2109 Western Dr
- 2202 Western Dr
- 1209 W Pecan Ave
- 2105 Oaklawn Dr
- 2704 N L St
- 2000 Neely Ave
- 2016 Gulf Prairie Ln
- 2609 Mcclintic St
- 1602 Winfield Rd
- 2207 Raleigh Point Dr
- 907 Shirley Ct
- 1606 Shell Ave
- 1210 W Scharbauer Dr
- 2603 Hodges St
- 1202 W Scharbauer Dr
- 1200 W Scharbauer Dr
- 1605 Shell Ave
- 1607 Shell Ave
- 806 Stanolind Ave
- 1501 Neely Ave
- 1505 Neely Ave
- 1502 Seaboard Ave
- 1504 Seaboard Ave
- 1500 Seaboard Ave
- 1502 Neely Ave
- 1504 Neely Ave
- 1500 Neely Ave
- 1601 Neely Ave
- 2218 N H St
- 2216 N H St
- 2214 N H St
- 1600 Seaboard Ave
- 1600 Neely Ave
- 2212 N H St
- 1503 W Pecan Ave
- 2210 N H St
- 1603 Neely Ave
- 1503 Seaboard Ave
- 1501 W Pecan Ave