Estimated Value: $233,000 - $240,000
3
Beds
2
Baths
1,278
Sq Ft
$186/Sq Ft
Est. Value
About This Home
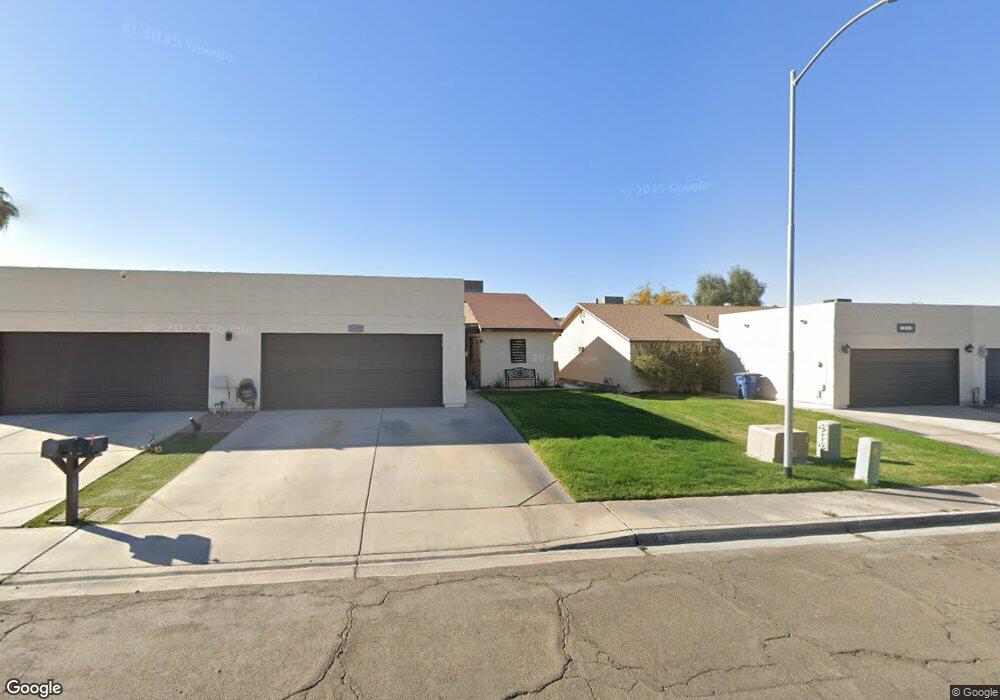
This home is located at 1503 W 12th Ln, Yuma, AZ 85364 and is currently estimated at $237,862, approximately $186 per square foot. 1503 W 12th Ln is a home located in Yuma County with nearby schools including O. C. Johnson Elementary School, R. Pete Woodard Junior High School, and Yuma High School.
Ownership History
Date
Name
Owned For
Owner Type
Purchase Details
Closed on
Apr 17, 2013
Sold by
Strecker Robert Dean
Bought by
Saulter Kyle Thomas
Current Estimated Value
Home Financials for this Owner
Home Financials are based on the most recent Mortgage that was taken out on this home.
Original Mortgage
$93,279
Outstanding Balance
$65,182
Interest Rate
3.25%
Mortgage Type
FHA
Estimated Equity
$172,680
Purchase Details
Closed on
May 22, 2000
Sold by
Strecker Robert D and Strecker Mary
Bought by
Strecker Robert D and Strecker Mary A
Home Financials for this Owner
Home Financials are based on the most recent Mortgage that was taken out on this home.
Original Mortgage
$43,000
Interest Rate
8.08%
Mortgage Type
New Conventional
Purchase Details
Closed on
May 2, 2000
Sold by
Grove Larry A and Grove Donna
Bought by
Strecker Robert D and Strecker Mary A
Home Financials for this Owner
Home Financials are based on the most recent Mortgage that was taken out on this home.
Original Mortgage
$43,000
Interest Rate
8.08%
Mortgage Type
New Conventional
Create a Home Valuation Report for This Property
The Home Valuation Report is an in-depth analysis detailing your home's value as well as a comparison with similar homes in the area
Home Values in the Area
Average Home Value in this Area
Purchase History
| Date | Buyer | Sale Price | Title Company |
|---|---|---|---|
| Saulter Kyle Thomas | $95,000 | Chicago Title | |
| Strecker Robert D | -- | First American Title | |
| Strecker Robert D | $83,000 | First American Title |
Source: Public Records
Mortgage History
| Date | Status | Borrower | Loan Amount |
|---|---|---|---|
| Open | Saulter Kyle Thomas | $93,279 | |
| Previous Owner | Strecker Robert D | $43,000 |
Source: Public Records
Tax History Compared to Growth
Tax History
| Year | Tax Paid | Tax Assessment Tax Assessment Total Assessment is a certain percentage of the fair market value that is determined by local assessors to be the total taxable value of land and additions on the property. | Land | Improvement |
|---|---|---|---|---|
| 2025 | $1,334 | $13,301 | $2,671 | $10,630 |
| 2024 | $1,310 | $12,668 | $2,583 | $10,085 |
| 2023 | $1,310 | $12,065 | $2,501 | $9,564 |
| 2022 | $1,264 | $11,490 | $2,702 | $8,788 |
| 2021 | $1,341 | $10,943 | $2,432 | $8,511 |
| 2020 | $1,225 | $10,422 | $2,367 | $8,055 |
| 2019 | $1,203 | $9,926 | $2,670 | $7,256 |
| 2018 | $1,150 | $9,504 | $2,569 | $6,935 |
| 2017 | $1,100 | $9,504 | $2,569 | $6,935 |
| 2016 | $1,075 | $8,620 | $2,344 | $6,276 |
| 2015 | $887 | $8,210 | $2,099 | $6,111 |
| 2014 | $887 | $7,819 | $2,600 | $5,219 |
Source: Public Records
Map
Nearby Homes
- 1632 W 12th Ln
- 1465 W Santa Maria Way
- 1432 S Sunset Dr
- 1602 W Las Lomas St
- 1168 S Jewel Ave
- 1138 S Jewel Ave
- 1076 S Myrtle Ave
- 1569 W Las Lomas St
- 1493 W 15th St
- 1531 W 15th St
- 1469 W 15th St
- 1172 S Franklin Ave
- 1409 S 13th Ave
- 1044 S 20th Ave
- 2119 W 12 Ln
- 1299 S 11th Ave
- 1065 S Dora Ave
- 1900 W 15 St
- 1330 S 10th Ave
- 1473 W 8th Place
- 1513 W 12th Ln
- 1463 W 12th Ln
- 1523 W 12th Ln
- 1453 W 12th Ln
- 1504 W Santa Maria Way
- 1514 W Santa Maria Way
- 1464 W Santa Maria Way
- 1443 W 12th Ln
- 1533 W 12th Ln
- 1524 W Santa Maria Way
- 1524 W Santa Maria Way
- 1454 W Santa Maria Way
- 1444 W Santa Maria Way
- 1534 W Santa Maria Way
- 1543 W 12th Ln
- 1502 W 12th Ln
- 1512 W 12th Ln
- 1433 W 12th Ln
- 1462 W 12th Ln
- 1522 W 12th Ln