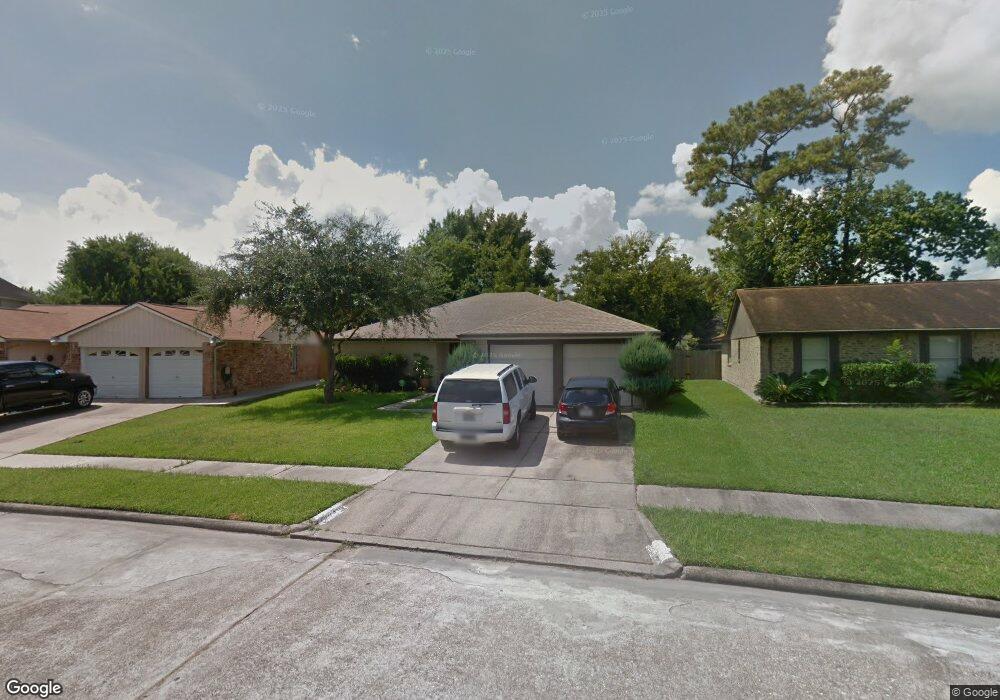
15030 Rockington Ln Channelview, TX 77530
Estimated Value: $242,000 - $257,000
4
Beds
2
Baths
1,882
Sq Ft
$131/Sq Ft
Est. Value
About This Home
This home is located at 15030 Rockington Ln, Channelview, TX 77530 and is currently estimated at $247,237, approximately $131 per square foot. 15030 Rockington Ln is a home located in Harris County with nearby schools including Channelview High School.
Ownership History
Date
Name
Owned For
Owner Type
Purchase Details
Closed on
May 5, 2004
Sold by
Carrasco Loreto
Bought by
Carrasco Maria C
Current Estimated Value
Home Financials for this Owner
Home Financials are based on the most recent Mortgage that was taken out on this home.
Original Mortgage
$68,000
Interest Rate
5.53%
Mortgage Type
New Conventional
Purchase Details
Closed on
Jul 31, 1997
Sold by
Marcantel Bonnie D
Bought by
Carrasco Maria C and Carrasco Loreto
Home Financials for this Owner
Home Financials are based on the most recent Mortgage that was taken out on this home.
Original Mortgage
$66,462
Interest Rate
7.6%
Mortgage Type
FHA
Purchase Details
Closed on
Sep 24, 1993
Sold by
Contreras Librado Lorenzo
Bought by
Marcantel Bonnie D
Home Financials for this Owner
Home Financials are based on the most recent Mortgage that was taken out on this home.
Original Mortgage
$54,800
Interest Rate
7.11%
Create a Home Valuation Report for This Property
The Home Valuation Report is an in-depth analysis detailing your home's value as well as a comparison with similar homes in the area
Home Values in the Area
Average Home Value in this Area
Purchase History
| Date | Buyer | Sale Price | Title Company |
|---|---|---|---|
| Carrasco Maria C | -- | Fidelity National Title | |
| Carrasco Maria C | -- | Houston Title | |
| Marcantel Bonnie D | -- | -- |
Source: Public Records
Mortgage History
| Date | Status | Borrower | Loan Amount |
|---|---|---|---|
| Closed | Carrasco Maria C | $68,000 | |
| Closed | Carrasco Maria C | $66,462 | |
| Previous Owner | Marcantel Bonnie D | $54,800 |
Source: Public Records
Tax History Compared to Growth
Tax History
| Year | Tax Paid | Tax Assessment Tax Assessment Total Assessment is a certain percentage of the fair market value that is determined by local assessors to be the total taxable value of land and additions on the property. | Land | Improvement |
|---|---|---|---|---|
| 2025 | $3,369 | $225,171 | $39,485 | $185,686 |
| 2024 | $3,369 | $228,700 | $39,485 | $189,215 |
| 2023 | $3,369 | $235,497 | $39,485 | $196,012 |
| 2022 | $4,474 | $205,473 | $39,485 | $165,988 |
| 2021 | $4,308 | $178,279 | $39,485 | $138,794 |
| 2020 | $4,280 | $155,517 | $39,485 | $116,032 |
| 2019 | $4,052 | $151,052 | $33,148 | $117,904 |
| 2018 | $1,449 | $136,151 | $31,574 | $104,577 |
| 2017 | $3,422 | $136,151 | $31,574 | $104,577 |
| 2016 | $3,111 | $113,903 | $25,259 | $88,644 |
| 2015 | $2,413 | $102,636 | $14,524 | $88,112 |
| 2014 | $2,413 | $95,370 | $11,998 | $83,372 |
Source: Public Records
Map
Nearby Homes
- 1343 Littleport Ln
- 1323 Padstow Ln
- 909 Pennygent Ln
- 1330 Stevenage Ln
- 14951 Scotter Dr
- 15223 Bedford Glen Dr
- 14918 Silver Green Dr S
- 1502 Stevenage Ln
- 1123 Maclesby Ln
- 1315 Goswell Ln
- 1102 Heathfield Dr
- 15262 Mincing Ln
- 15215 Peachmeadow Ln
- 1034 Littleport Ln
- 1423 Seafield Dr
- 14835 Scotter Dr
- 15307 Streatham Cir
- 1303 Sterling Green Ct
- 15318 Streatham Cir
- 1130 Fairlane Square
- 15034 Rockington Ln
- 15026 Rockington Ln
- 1387 Pennygent Ln
- 1358 Holbech Ln
- 15038 Rockington Ln
- 15022 Rockington Ln
- 1363 Littleport Ln
- 1383 Pennygent Ln
- 15035 Rockington Ln
- 1359 Littleport Ln
- 15031 Rockington Ln
- 1354 Holbech Ln
- 15042 Rockington Ln
- 15018 Rockington Ln
- 15027 Rockington Ln
- 15039 Rockington Ln
- 1367 Littleport Ln
- 1350 Holbech Ln
- 1379 Pennygent Ln
- 15023 Rockington Ln