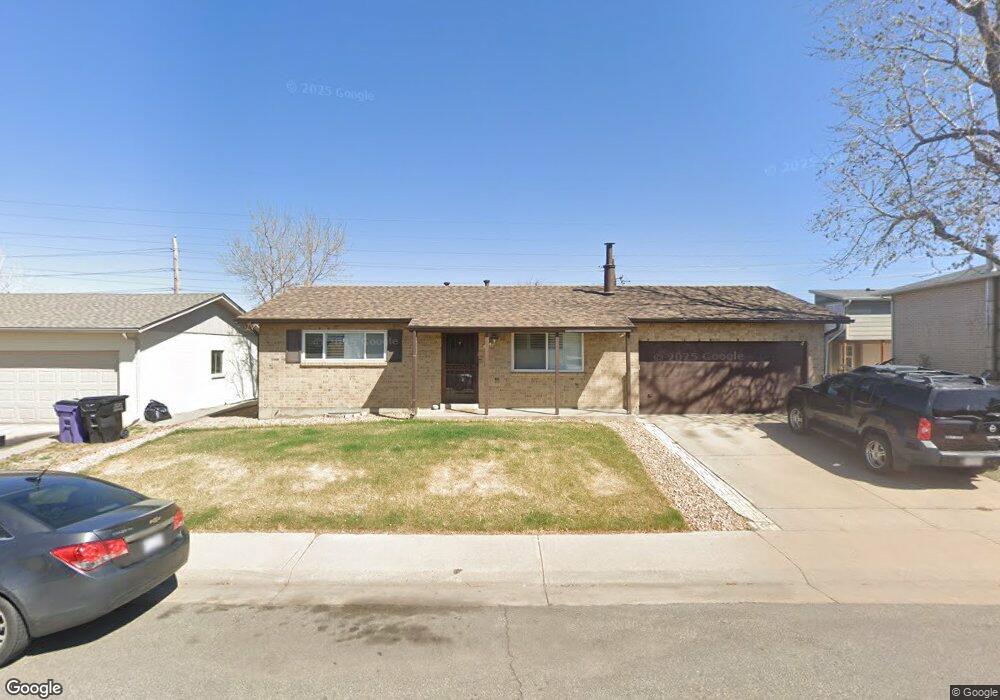
15031 Randolph Place Denver, CO 80239
Montbello NeighborhoodEstimated Value: $422,000 - $466,000
4
Beds
2
Baths
1,954
Sq Ft
$231/Sq Ft
Est. Value
About This Home
This home is located at 15031 Randolph Place, Denver, CO 80239 and is currently estimated at $450,451, approximately $230 per square foot. 15031 Randolph Place is a home located in Denver County with nearby schools including Dcis At Ford, McGlone Academy, and Pitt-Waller K-8 School.
Ownership History
Date
Name
Owned For
Owner Type
Purchase Details
Closed on
Jul 8, 2019
Sold by
Abolaji Realty Inc
Bought by
Ornelas Carlos Ruben Ibarra and Ornelas Elva D Ibarra
Current Estimated Value
Home Financials for this Owner
Home Financials are based on the most recent Mortgage that was taken out on this home.
Original Mortgage
$343,660
Outstanding Balance
$307,240
Interest Rate
4.87%
Mortgage Type
FHA
Estimated Equity
$143,211
Purchase Details
Closed on
Nov 8, 2018
Sold by
Mcminimee Marcie R and Estate Of Robert Cossia Jr
Bought by
Abolaji Realty Inc
Purchase Details
Closed on
Nov 27, 2006
Sold by
Smith Gerald Stephen and Smith Patricia Mary
Bought by
Cossia Robert W
Home Financials for this Owner
Home Financials are based on the most recent Mortgage that was taken out on this home.
Original Mortgage
$127,920
Interest Rate
7.89%
Mortgage Type
Balloon
Create a Home Valuation Report for This Property
The Home Valuation Report is an in-depth analysis detailing your home's value as well as a comparison with similar homes in the area
Home Values in the Area
Average Home Value in this Area
Purchase History
| Date | Buyer | Sale Price | Title Company |
|---|---|---|---|
| Ornelas Carlos Ruben Ibarra | $350,000 | First American | |
| Abolaji Realty Inc | $230,000 | None Available | |
| Cossia Robert W | $159,900 | Fahtco |
Source: Public Records
Mortgage History
| Date | Status | Borrower | Loan Amount |
|---|---|---|---|
| Open | Ornelas Carlos Ruben Ibarra | $343,660 | |
| Previous Owner | Cossia Robert W | $127,920 |
Source: Public Records
Tax History Compared to Growth
Tax History
| Year | Tax Paid | Tax Assessment Tax Assessment Total Assessment is a certain percentage of the fair market value that is determined by local assessors to be the total taxable value of land and additions on the property. | Land | Improvement |
|---|---|---|---|---|
| 2024 | $2,222 | $28,050 | $1,680 | $26,370 |
| 2023 | $2,174 | $28,050 | $1,680 | $26,370 |
| 2022 | $1,989 | $25,010 | $5,570 | $19,440 |
| 2021 | $1,989 | $25,730 | $5,730 | $20,000 |
| 2020 | $1,595 | $21,500 | $5,730 | $15,770 |
| 2019 | $1,550 | $21,500 | $5,730 | $15,770 |
| 2018 | $1,273 | $16,450 | $3,460 | $12,990 |
| 2017 | $1,269 | $16,450 | $3,460 | $12,990 |
| 2016 | $941 | $11,540 | $3,184 | $8,356 |
| 2015 | $902 | $11,540 | $3,184 | $8,356 |
| 2014 | $667 | $8,030 | $1,990 | $6,040 |
Source: Public Records
Map
Nearby Homes
- 15053 Lackland Place
- 14804 Maxwell Place
- 5426 Eagle St
- 14602 Randolph Place
- 5553 Jasper St
- 5342 Altura St
- 4050 N Kittredge St
- 5519 Chandler Ct
- 5542 Crown Blvd
- 5549 Carson Way
- 5251 Altura St
- 16106 Randolph Place
- 5563 Blackhawk Way
- 14695 E 51st Place
- 15627 E 51st Dr
- 15644 E 50th Ave
- 14040 E 54th Ave
- 5117 Kittredge St
- 5255 Memphis St Unit 312
- 5255 Memphis St Unit 207
- 15041 Randolph Place
- 15032 Randolph Place
- 15011 Randolph Place
- 15051 Randolph Place
- 15022 Randolph Place
- 15042 Randolph Place
- 15001 Randolph Place
- 15012 Randolph Place
- 15061 Randolph Place
- 15052 Randolph Place
- 15002 Randolph Place
- 15071 Randolph Place
- 15072 Randolph Place
- 15035 Robins Dr
- 15025 Robins Dr
- 15045 Robins Dr
- 15015 Robins Dr
- 15055 Robins Dr
- 14991 Randolph Place
- 15075 Robins Dr