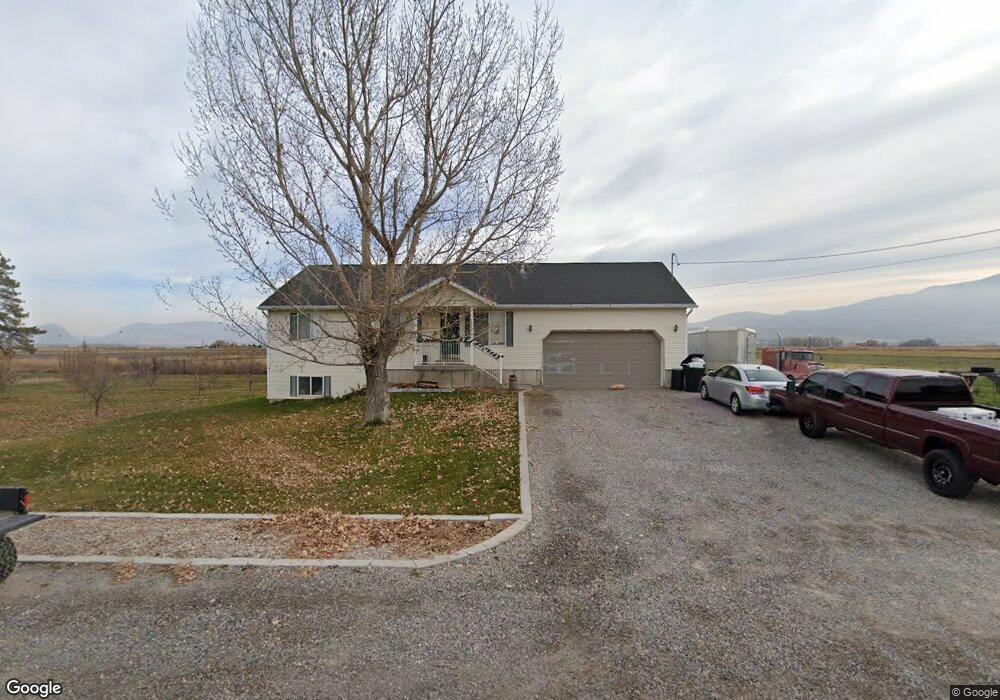
15035 N 4400 W Garland, UT 84312
Estimated Value: $395,000 - $508,000
5
Beds
3
Baths
2,733
Sq Ft
$174/Sq Ft
Est. Value
About This Home
This home is located at 15035 N 4400 W, Garland, UT 84312 and is currently estimated at $475,322, approximately $173 per square foot. 15035 N 4400 W is a home located in Box Elder County with nearby schools including Fielding School, Bear River Middle School, and Alice C. Harris Intermediate School.
Ownership History
Date
Name
Owned For
Owner Type
Purchase Details
Closed on
Feb 22, 2022
Sold by
Marble Judson B and Marble Gina R
Bought by
Binder Kyler J
Current Estimated Value
Home Financials for this Owner
Home Financials are based on the most recent Mortgage that was taken out on this home.
Original Mortgage
$307,000
Outstanding Balance
$285,073
Interest Rate
3.55%
Mortgage Type
New Conventional
Estimated Equity
$190,249
Purchase Details
Closed on
Sep 10, 2010
Sold by
Banks Gina R and Marble Judson B
Bought by
Marble Judson B and Marble Gina R
Home Financials for this Owner
Home Financials are based on the most recent Mortgage that was taken out on this home.
Original Mortgage
$181,264
Interest Rate
4.5%
Mortgage Type
FHA
Purchase Details
Closed on
Sep 23, 2009
Sold by
Walz Myron E and Walz Cheree
Bought by
Banks Gina R and Marble Judson B
Home Financials for this Owner
Home Financials are based on the most recent Mortgage that was taken out on this home.
Original Mortgage
$174,677
Interest Rate
5.25%
Mortgage Type
FHA
Create a Home Valuation Report for This Property
The Home Valuation Report is an in-depth analysis detailing your home's value as well as a comparison with similar homes in the area
Home Values in the Area
Average Home Value in this Area
Purchase History
| Date | Buyer | Sale Price | Title Company |
|---|---|---|---|
| Binder Kyler J | -- | Northern Title | |
| Marble Judson B | -- | -- | |
| Marble Judson B | -- | None Available | |
| Banks Gina R | -- | -- |
Source: Public Records
Mortgage History
| Date | Status | Borrower | Loan Amount |
|---|---|---|---|
| Open | Binder Kyler J | $307,000 | |
| Previous Owner | Marble Judson B | $181,264 | |
| Previous Owner | Banks Gina R | $174,677 |
Source: Public Records
Tax History Compared to Growth
Tax History
| Year | Tax Paid | Tax Assessment Tax Assessment Total Assessment is a certain percentage of the fair market value that is determined by local assessors to be the total taxable value of land and additions on the property. | Land | Improvement |
|---|---|---|---|---|
| 2025 | $2,266 | $439,672 | $130,000 | $309,672 |
| 2024 | $2,002 | $440,465 | $130,000 | $310,465 |
| 2023 | $2,061 | $458,704 | $130,000 | $328,704 |
| 2022 | $2,081 | $240,023 | $35,750 | $204,273 |
| 2021 | $1,718 | $203,087 | $30,000 | $173,087 |
| 2020 | $1,126 | $203,087 | $30,000 | $173,087 |
| 2019 | $1,010 | $95,165 | $16,500 | $78,665 |
| 2018 | $967 | $86,358 | $16,500 | $69,858 |
| 2017 | $1,001 | $155,825 | $16,500 | $125,825 |
| 2016 | $956 | $83,101 | $16,500 | $66,601 |
| 2015 | $848 | $75,725 | $16,500 | $59,225 |
| 2014 | $848 | $72,905 | $16,500 | $56,405 |
| 2013 | -- | $67,777 | $16,500 | $51,277 |
Source: Public Records
Map
Nearby Homes
- 15125 N 4400 W
- 15920 N 4000 W Unit 14
- 15270 N 5475 W
- 14296 N 5350 W
- 3536 W 14100 N
- 4770 W 13600 N
- 303 S Center St
- 16580 N 5200 W
- 14360 N 6000 W
- 14376 N 6000 W
- 95 E 100 S
- 14345 N 6000 W
- 13700 N 3100 W
- 95 W 100 N
- 16115 N 6000 W
- Berrington Plan at Lookout Mountain
- Stanton Plan at Lookout Mountain
- Cambria Plan at Lookout Mountain
- Brantwood Plan at Lookout Mountain
- Hallwood Plan at Lookout Mountain