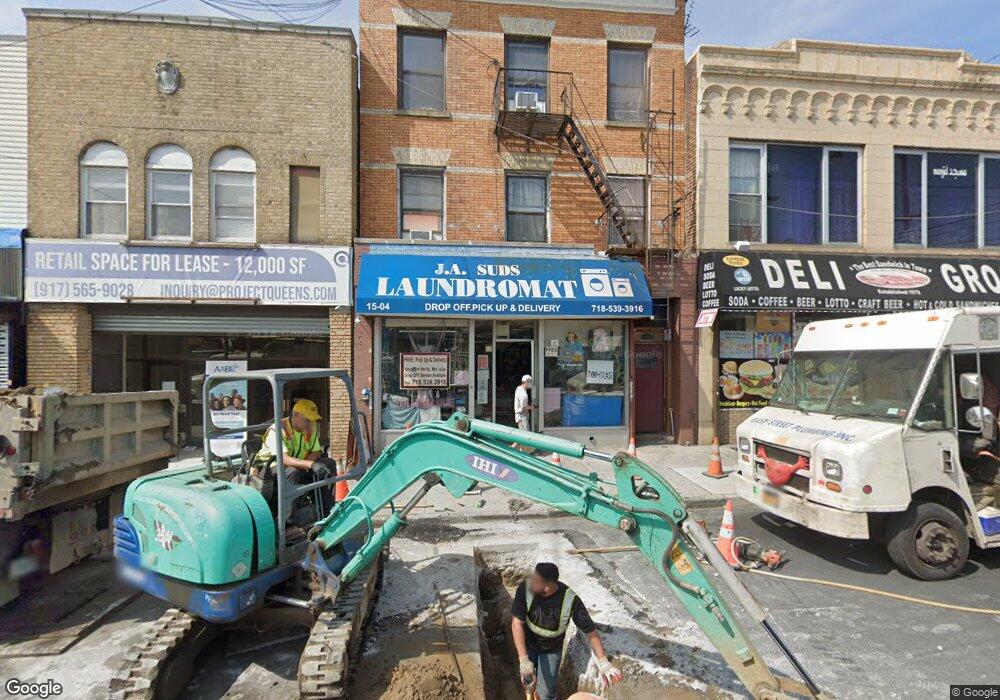
1504 College Point Blvd College Point, NY 11356
College Point NeighborhoodEstimated Value: $1,892,595
4
Beds
5
Baths
3,720
Sq Ft
$509/Sq Ft
Est. Value
About This Home
This home is located at 1504 College Point Blvd, College Point, NY 11356 and is currently estimated at $1,892,595, approximately $508 per square foot. 1504 College Point Blvd is a home located in Queens County with nearby schools including P.S. 129 Patricia Larkin, J.H.S. 194 William Carr, and Flushing High School.
Ownership History
Date
Name
Owned For
Owner Type
Purchase Details
Closed on
Dec 22, 2017
Sold by
Pharmhealth 162 Llc
Bought by
Cp Realty Group Llc
Current Estimated Value
Home Financials for this Owner
Home Financials are based on the most recent Mortgage that was taken out on this home.
Original Mortgage
$740,000
Outstanding Balance
$622,693
Interest Rate
3.92%
Mortgage Type
Purchase Money Mortgage
Estimated Equity
$1,269,902
Purchase Details
Closed on
Jun 10, 2016
Sold by
M H Su Llc
Bought by
Pharmhealth 162 Llc
Purchase Details
Closed on
Jul 1, 2014
Sold by
Chen Cheng Ru
Bought by
M H Su Llc
Purchase Details
Closed on
Dec 9, 2011
Sold by
Sirris Markella and Tsalikis Demetrios
Bought by
Chen Cheng Ru
Home Financials for this Owner
Home Financials are based on the most recent Mortgage that was taken out on this home.
Original Mortgage
$410,000
Interest Rate
4%
Mortgage Type
Commercial
Create a Home Valuation Report for This Property
The Home Valuation Report is an in-depth analysis detailing your home's value as well as a comparison with similar homes in the area
Home Values in the Area
Average Home Value in this Area
Purchase History
| Date | Buyer | Sale Price | Title Company |
|---|---|---|---|
| Cp Realty Group Llc | $1,500,000 | -- | |
| Pharmhealth 162 Llc | $1,388,000 | -- | |
| M H Su Llc | $920,000 | -- | |
| Chen Cheng Ru | $745,000 | -- |
Source: Public Records
Mortgage History
| Date | Status | Borrower | Loan Amount |
|---|---|---|---|
| Open | Cp Realty Group Llc | $740,000 | |
| Previous Owner | Chen Cheng Ru | $410,000 |
Source: Public Records
Tax History Compared to Growth
Tax History
| Year | Tax Paid | Tax Assessment Tax Assessment Total Assessment is a certain percentage of the fair market value that is determined by local assessors to be the total taxable value of land and additions on the property. | Land | Improvement |
|---|---|---|---|---|
| 2025 | $39,224 | $338,840 | $170,678 | $168,162 |
| 2024 | $39,224 | $313,741 | $183,305 | $130,436 |
| 2023 | $38,081 | $304,602 | $187,904 | $116,698 |
| 2022 | $36,869 | $351,450 | $213,750 | $137,700 |
| 2021 | $34,228 | $327,600 | $213,750 | $113,850 |
| 2020 | $32,510 | $359,100 | $213,750 | $145,350 |
| 2019 | $30,438 | $332,640 | $213,750 | $118,890 |
| 2018 | $29,802 | $234,309 | $120,451 | $113,858 |
| 2017 | $29,483 | $231,803 | $126,851 | $104,952 |
| 2016 | $27,670 | $231,803 | $126,851 | $104,952 |
| 2015 | $17,964 | $200,497 | $153,855 | $46,642 |
| 2014 | $17,964 | $185,646 | $157,749 | $27,897 |
Source: Public Records
Map
Nearby Homes
- 18-35/39 College Point Blvd
- 120-17 18th Ave
- 12-22 120th St
- 11914 15th Ave
- 1830 124th St
- 123-09 20th Ave
- 12011 14th Rd
- 14-21 121st St
- 124-17 18th Ave
- 18-43 124th St
- 18-42 120th St
- 20-11 College Point Blvd
- 119-07 14th Rd
- 125-15 18th Ave
- 20-22 College Point Blvd
- 20-12 120th St
- 119-18 14th Ave
- 3 Beech Court Cir
- 1314 College Point Blvd
- 2105 123rd St
- 1508 College Point Blvd Unit 1
- 1508 College Point Blvd
- 1504 College Point Blvd Unit 3
- 1504 College Point Blvd Unit 3R
- 1504 College Point Blvd Unit BLVD
- 1504 College Point Blvd
- 1510 College Point Blvd
- 15-02 College Point Blvd
- 1502 College Point Blvd
- 15-14 College Point Blvd Unit 3F
- 1512 College Point Blvd Unit 4
- 1512 College Point Blvd
- 1514 College Point Blvd
- 121-08 15th Ave
- 12108 15th Ave
- 1516 College Point Blvd
- 15-16 College Point Blvd Unit Store
- 1518 College Point Blvd
- 15-18 College Point Blvd Unit Ground
- 15-18 College Point Blvd