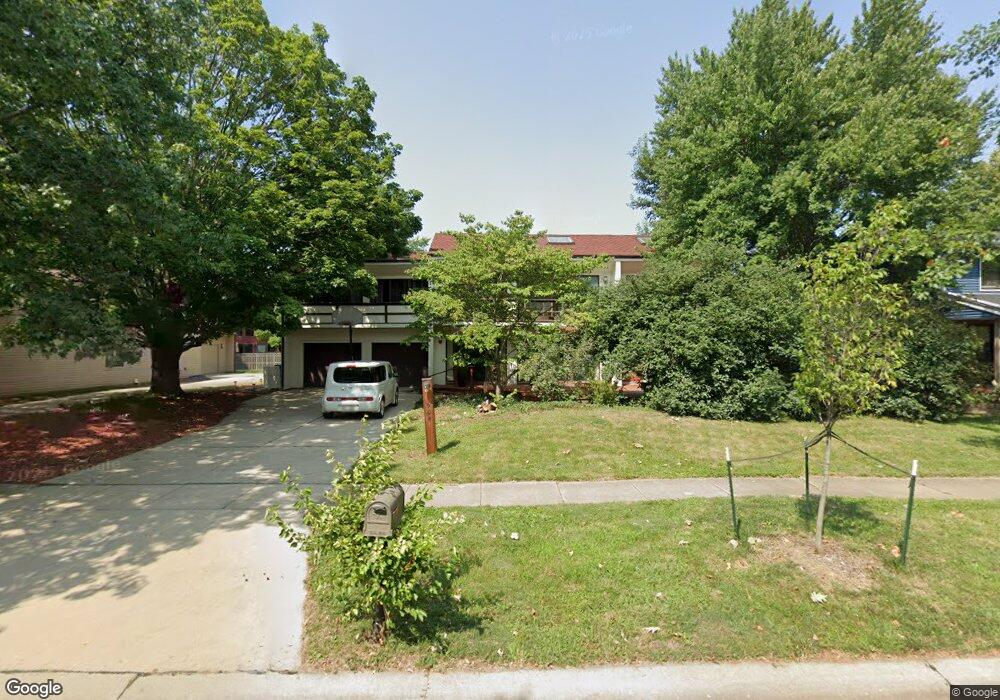
1504 Devonshire Dr Champaign, IL 61821
Bolten Field NeighborhoodEstimated Value: $282,000 - $385,000
Studio
3
Baths
1,898
Sq Ft
$172/Sq Ft
Est. Value
About This Home
This home is located at 1504 Devonshire Dr, Champaign, IL 61821 and is currently estimated at $327,371, approximately $172 per square foot. 1504 Devonshire Dr is a home located in Champaign County with nearby schools including Central High School, Next Generation School, and Devonshire KinderCare.
Ownership History
Date
Name
Owned For
Owner Type
Purchase Details
Closed on
May 13, 2025
Sold by
Rodriguez-Rivera Jacobo and Bouton Kristin L
Bought by
Kristin Bouton and Jacobo Rodriguez-Rivera
Current Estimated Value
Purchase Details
Closed on
Dec 13, 2012
Sold by
Rogers Stephen J and Rogers Christine A
Bought by
Bouton Kristin L and Rodriguez Rivera Jacobo
Home Financials for this Owner
Home Financials are based on the most recent Mortgage that was taken out on this home.
Original Mortgage
$112,000
Interest Rate
3.36%
Mortgage Type
New Conventional
Purchase Details
Closed on
Jun 25, 2007
Sold by
Martin Richard M and Martin Beverly C
Bought by
Rogers Stephen J and Rogers Christine A
Home Financials for this Owner
Home Financials are based on the most recent Mortgage that was taken out on this home.
Original Mortgage
$189,900
Interest Rate
6.2%
Mortgage Type
Purchase Money Mortgage
Create a Home Valuation Report for This Property
The Home Valuation Report is an in-depth analysis detailing your home's value as well as a comparison with similar homes in the area
Home Values in the Area
Average Home Value in this Area
Purchase History
| Date | Buyer | Sale Price | Title Company |
|---|---|---|---|
| Kristin Bouton | -- | None Listed On Document | |
| Bouton Kristin L | $140,000 | None Available | |
| Rogers Stephen J | $190,000 | None Available |
Source: Public Records
Mortgage History
| Date | Status | Borrower | Loan Amount |
|---|---|---|---|
| Previous Owner | Bouton Kristin L | $112,000 | |
| Previous Owner | Rogers Stephen J | $189,900 |
Source: Public Records
Tax History
| Year | Tax Paid | Tax Assessment Tax Assessment Total Assessment is a certain percentage of the fair market value that is determined by local assessors to be the total taxable value of land and additions on the property. | Land | Improvement |
|---|---|---|---|---|
| 2024 | $6,579 | $86,690 | $16,240 | $70,450 |
| 2023 | $6,579 | $78,950 | $14,790 | $64,160 |
| 2022 | $6,146 | $72,830 | $13,640 | $59,190 |
| 2021 | $5,987 | $71,400 | $13,370 | $58,030 |
| 2020 | $5,745 | $68,660 | $12,860 | $55,800 |
| 2019 | $5,549 | $67,250 | $12,600 | $54,650 |
Source: Public Records
Map
Nearby Homes
- 1506 Sandpiper Ln
- 2134 Harbortown Cir
- 2144 Harbortown Cir Unit 2144
- 2159 Harbortown Cir Unit 2159
- 2211 Carlisle Dr
- 1310 Broadmoor Dr
- 2111 Sunview Dr
- 2113 Sunview Dr
- 1722 Lakeside Dr
- 1205 Broadmoor Dr
- 1713 Harbor Point Dr Unit B
- 2317 Brookshire E
- 2130 Ivy Ct
- 2001 S Mattis Ave Unit E
- 1928 Blackthorn Dr Unit 1
- 2404 Windward Blvd Unit 201
- 2404 Windward Blvd Unit 202
- 1901 Blackthorn Dr
- 2410 Stillwater Dr
- 2205 Southmoor Dr
- 1508 Devonshire Dr
- 1502 Devonshire Dr
- 2003 Mayfair Rd
- 1503 Sandpiper Ln
- 1512 Devonshire Dr
- 1505 Sandpiper Ln
- 1501 Sandpiper Ln
- 1501 Sandpiper Ln Unit 1
- 1503 Devonshire Ct
- 2101 Mayfair Rd
- 1507 Sandpiper Ln
- 1514 Devonshire Dr
- 1505 Devonshire Ct
- 2008 Mayfair Rd
- 2006 Mayfair Rd
- 1515 Devonshire Dr
- 2004 Mayfair Rd
- 2103 Mayfair Rd
- 1509 Sandpiper Ln
- 1504 Sandpiper Ln
Your Personal Tour Guide
Ask me questions while you tour the home.