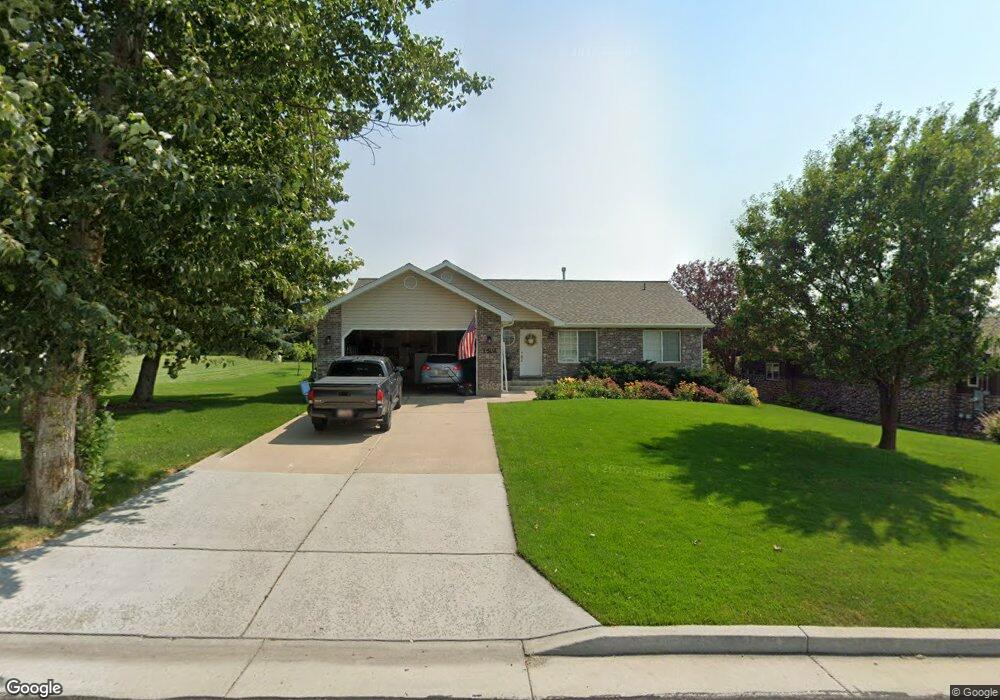
1504 E 2100 N North Logan, UT 84341
Estimated Value: $471,000 - $534,000
6
Beds
3
Baths
2,600
Sq Ft
$191/Sq Ft
Est. Value
About This Home
This home is located at 1504 E 2100 N, North Logan, UT 84341 and is currently estimated at $497,735, approximately $191 per square foot. 1504 E 2100 N is a home located in Cache County with nearby schools including Greenville School, Cedar Ridge School, and North Cache Middle School.
Ownership History
Date
Name
Owned For
Owner Type
Purchase Details
Closed on
Sep 29, 2011
Sold by
Cardon Grant Edmund and Cardon Kay Lyn
Bought by
Cardon Grant E and Cardon Kay Lyn
Current Estimated Value
Home Financials for this Owner
Home Financials are based on the most recent Mortgage that was taken out on this home.
Original Mortgage
$95,000
Outstanding Balance
$7,654
Interest Rate
4.16%
Mortgage Type
New Conventional
Estimated Equity
$490,081
Purchase Details
Closed on
Aug 10, 2007
Sold by
Cardon Grant E and Cardon Kay Lyn
Bought by
Cardon Grant E and Cardon Kay Lyn
Purchase Details
Closed on
Jul 20, 2005
Sold by
Kent Annette H and Kent Justin A
Bought by
Cardon Grant E and Cardon Kay Lyn
Home Financials for this Owner
Home Financials are based on the most recent Mortgage that was taken out on this home.
Original Mortgage
$102,300
Interest Rate
5.51%
Mortgage Type
New Conventional
Create a Home Valuation Report for This Property
The Home Valuation Report is an in-depth analysis detailing your home's value as well as a comparison with similar homes in the area
Home Values in the Area
Average Home Value in this Area
Purchase History
| Date | Buyer | Sale Price | Title Company |
|---|---|---|---|
| Cardon Grant E | -- | Pinnacle Title Ins Agency | |
| Cardon Grant Edmund | -- | Pinnacle Title Ins Agency | |
| Cardon Grant E | -- | None Available | |
| Cardon Grant E | -- | Cache Title Company |
Source: Public Records
Mortgage History
| Date | Status | Borrower | Loan Amount |
|---|---|---|---|
| Open | Cardon Grant Edmund | $95,000 | |
| Closed | Cardon Grant E | $102,300 |
Source: Public Records
Tax History
| Year | Tax Paid | Tax Assessment Tax Assessment Total Assessment is a certain percentage of the fair market value that is determined by local assessors to be the total taxable value of land and additions on the property. | Land | Improvement |
|---|---|---|---|---|
| 2025 | $1,876 | $262,630 | $0 | $0 |
| 2024 | $2,042 | $266,000 | $0 | $0 |
| 2023 | $2,069 | $252,250 | $0 | $0 |
| 2022 | $1,906 | $222,000 | $0 | $0 |
| 2021 | $1,866 | $336,910 | $70,000 | $266,910 |
| 2020 | $1,579 | $267,340 | $70,000 | $197,340 |
| 2019 | $1,653 | $267,340 | $70,000 | $197,340 |
| 2018 | $1,541 | $241,600 | $70,000 | $171,600 |
| 2017 | $1,406 | $116,050 | $0 | $0 |
| 2016 | $1,428 | $116,050 | $0 | $0 |
| 2015 | $1,300 | $105,230 | $0 | $0 |
| 2014 | $1,269 | $105,230 | $0 | $0 |
| 2013 | -- | $105,230 | $0 | $0 |
Source: Public Records
Map
Nearby Homes
- 2025 N 1550 E
- 1495 E 2300 N
- 1872 N 515 W
- 1100 E 1900 N Unit 10
- 1593 N 110 W Unit 201
- 611 E 2450 N Unit 1
- 1593 N 110 W Unit 202
- 1593 N 110 W Unit 204
- 1200 W 1400 N
- 2950 N Mahogony Valley Rd E Unit 7
- 1598 N Sharptail Cir
- 1000 W 2500 N
- 1720 N 1850 E
- 1901 Southpointe Ct
- 1185 E 2500 N
- 1949 Deer Crest Cir Unit 49
- 1959 Deer Crest Cir
- 1810 N 2070 E Unit 10
- 1586 N Sharptail Cir
- 1450 N 1525 E
Your Personal Tour Guide
Ask me questions while you tour the home.