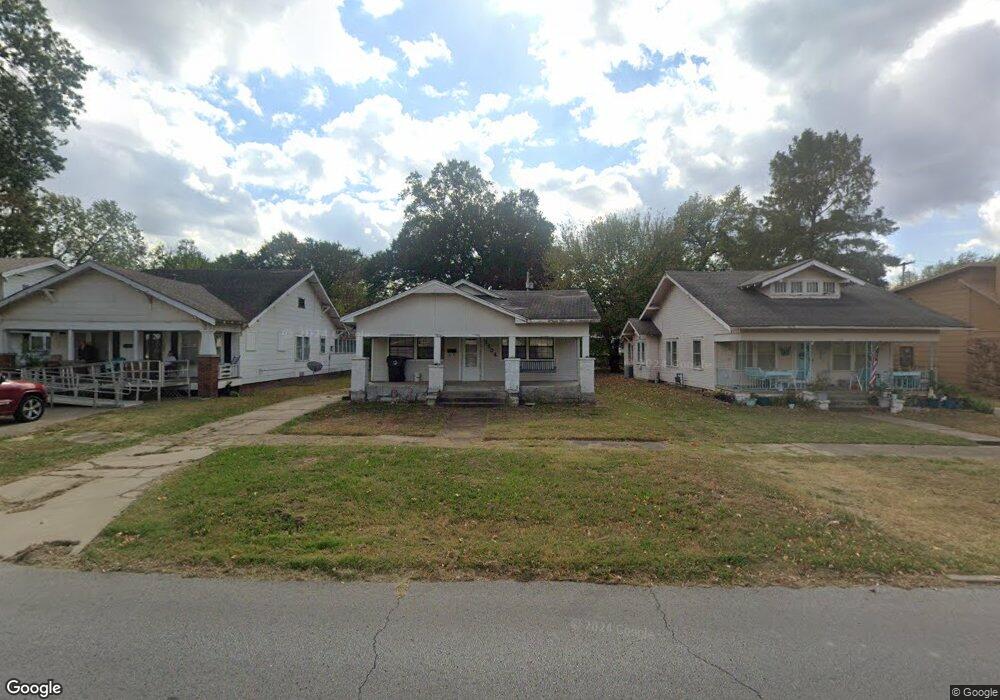
1504 E 8th St Okmulgee, OK 74447
Estimated Value: $63,972 - $137,000
3
Beds
1
Bath
1,019
Sq Ft
$103/Sq Ft
Est. Value
About This Home
This home is located at 1504 E 8th St, Okmulgee, OK 74447 and is currently estimated at $105,243, approximately $103 per square foot. 1504 E 8th St is a home located in Okmulgee County with nearby schools including Okmulgee Primary School, Dunbar Elementary School, and Okmulgee Middle School.
Ownership History
Date
Name
Owned For
Owner Type
Purchase Details
Closed on
Dec 14, 2005
Sold by
Baldridge Jessie Yvonne
Bought by
Baldridge Home Rental Llc
Current Estimated Value
Purchase Details
Closed on
Oct 19, 2005
Sold by
Gregorio Kyle L and Gregorio Alicia J
Bought by
Baldridge Jessie Yvonne
Purchase Details
Closed on
Oct 27, 2000
Sold by
Mccall Kim
Bought by
Greenley Michael and Greenley Ellen
Purchase Details
Closed on
Aug 25, 1998
Sold by
Roberds Tonja D
Bought by
Mccall Kim
Purchase Details
Closed on
Jul 19, 1994
Sold by
Bliss Sharon
Bought by
Roberds Tonja
Create a Home Valuation Report for This Property
The Home Valuation Report is an in-depth analysis detailing your home's value as well as a comparison with similar homes in the area
Home Values in the Area
Average Home Value in this Area
Purchase History
| Date | Buyer | Sale Price | Title Company |
|---|---|---|---|
| Baldridge Home Rental Llc | -- | None Available | |
| Baldridge Jessie Yvonne | $53,000 | None Available | |
| Greenley Michael | $36,000 | -- | |
| Mccall Kim | $38,000 | -- | |
| Roberds Tonja | $36,000 | -- |
Source: Public Records
Tax History
| Year | Tax Paid | Tax Assessment Tax Assessment Total Assessment is a certain percentage of the fair market value that is determined by local assessors to be the total taxable value of land and additions on the property. | Land | Improvement |
|---|---|---|---|---|
| 2025 | $389 | $4,251 | $270 | $3,981 |
| 2024 | $388 | $4,282 | $270 | $4,012 |
| 2023 | $400 | $4,614 | $270 | $4,344 |
| 2022 | $372 | $4,395 | $270 | $4,125 |
| 2021 | $370 | $4,395 | $270 | $4,125 |
| 2020 | $353 | $3,986 | $270 | $3,716 |
| 2019 | $335 | $3,797 | $270 | $3,527 |
| 2018 | $394 | $4,400 | $270 | $4,130 |
| 2017 | $443 | $5,000 | $270 | $4,730 |
| 2016 | $497 | $5,600 | $270 | $5,330 |
| 2015 | $534 | $6,200 | $270 | $5,930 |
| 2014 | $537 | $6,200 | $270 | $5,930 |
Source: Public Records
Map
Nearby Homes
Your Personal Tour Guide
Ask me questions while you tour the home.