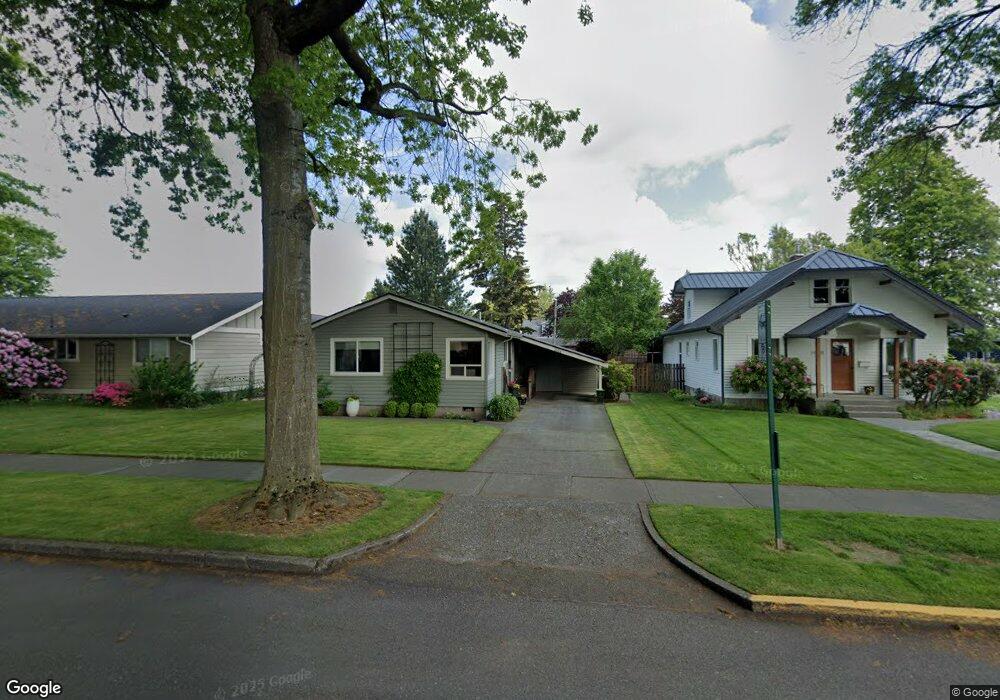
1504 Front St Lynden, WA 98264
Estimated Value: $399,381 - $477,000
2
Beds
1
Bath
880
Sq Ft
$493/Sq Ft
Est. Value
About This Home
This home is located at 1504 Front St, Lynden, WA 98264 and is currently estimated at $434,095, approximately $493 per square foot. 1504 Front St is a home located in Whatcom County with nearby schools including Lynden High School, Lynden Christian School, and Lynden Christian Schools: Administration.
Ownership History
Date
Name
Owned For
Owner Type
Purchase Details
Closed on
May 9, 2013
Sold by
Houston Daniel A and Houston Virginia
Bought by
Tenkley Keri L
Current Estimated Value
Home Financials for this Owner
Home Financials are based on the most recent Mortgage that was taken out on this home.
Original Mortgage
$133,600
Outstanding Balance
$93,953
Interest Rate
3.54%
Mortgage Type
New Conventional
Estimated Equity
$340,142
Purchase Details
Closed on
Jun 11, 2007
Sold by
Baas Elizabeth
Bought by
Houston Daniel A and Houston Virginia
Home Financials for this Owner
Home Financials are based on the most recent Mortgage that was taken out on this home.
Original Mortgage
$37,000
Interest Rate
6.14%
Mortgage Type
Credit Line Revolving
Create a Home Valuation Report for This Property
The Home Valuation Report is an in-depth analysis detailing your home's value as well as a comparison with similar homes in the area
Home Values in the Area
Average Home Value in this Area
Purchase History
| Date | Buyer | Sale Price | Title Company |
|---|---|---|---|
| Tenkley Keri L | $167,280 | Chicago Title Insurance | |
| Houston Daniel A | $185,280 | Chicago Title Insurance |
Source: Public Records
Mortgage History
| Date | Status | Borrower | Loan Amount |
|---|---|---|---|
| Open | Tenkley Keri L | $133,600 | |
| Previous Owner | Houston Daniel A | $37,000 | |
| Previous Owner | Houston Daniel A | $148,000 |
Source: Public Records
Tax History
| Year | Tax Paid | Tax Assessment Tax Assessment Total Assessment is a certain percentage of the fair market value that is determined by local assessors to be the total taxable value of land and additions on the property. | Land | Improvement |
|---|---|---|---|---|
| 2025 | $2,754 | $385,531 | $245,543 | $139,988 |
| 2024 | $2,620 | $362,568 | $218,250 | $144,318 |
| 2023 | $2,620 | $363,767 | $225,000 | $138,767 |
| 2022 | $1,895 | $248,223 | $109,660 | $138,563 |
| 2021 | $1,859 | $205,141 | $90,627 | $114,514 |
| 2020 | $1,629 | $183,166 | $80,919 | $102,247 |
| 2019 | $1,449 | $168,023 | $74,297 | $93,726 |
| 2018 | $1,584 | $153,203 | $67,682 | $85,521 |
| 2017 | $1,432 | $137,512 | $60,750 | $76,762 |
| 2016 | $1,357 | $132,201 | $55,000 | $77,201 |
| 2015 | $1,203 | $124,594 | $52,900 | $71,694 |
| 2014 | -- | $120,370 | $51,100 | $69,270 |
| 2013 | -- | $119,270 | $50,000 | $69,270 |
Source: Public Records
Map
Nearby Homes
- 1656 Liberty St Unit 101
- 1218 Front St
- 1717 E St
- 108 Fairside Dr Unit 1
- 1594 Farmview Terrace
- 0 Guide Meridian Unit NWM2369980
- 919 Liberty St
- 915 Front St
- 410 10th St
- 1774 Farmview Terrace
- 1701 Farmview Terrace
- 1710 Farmview Terrace
- 802 Edson St
- 1884 Front St Unit B
- 1884 Front St
- 1884 Front St Unit A
- 1882 Front St Unit B302
- 8424 Double Ditch Rd
- 8457 Benson Rd
- 801 19th St
Your Personal Tour Guide
Ask me questions while you tour the home.