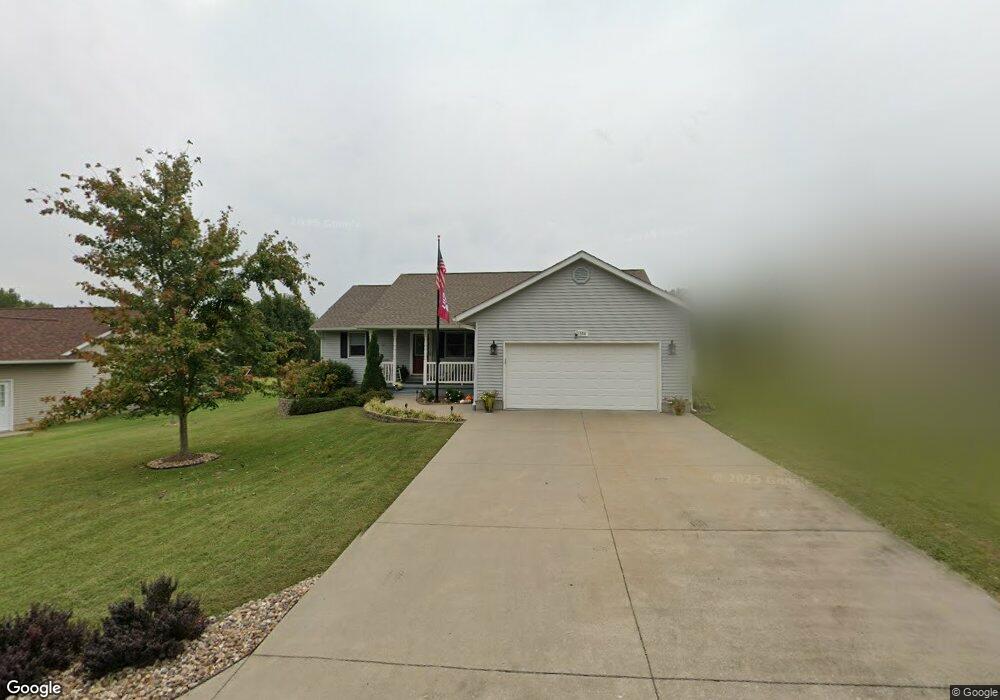
1504 Glopen Rd Carbondale, IL 62901
Estimated Value: $221,000 - $250,000
1
Bed
2
Baths
1,500
Sq Ft
$157/Sq Ft
Est. Value
About This Home
This home is located at 1504 Glopen Rd, Carbondale, IL 62901 and is currently estimated at $235,810, approximately $157 per square foot. 1504 Glopen Rd is a home located in Jackson County with nearby schools including Giant City Elementary School, Carbondale Community High School, and Carbondale New School.
Ownership History
Date
Name
Owned For
Owner Type
Purchase Details
Closed on
Aug 24, 2020
Sold by
Kelley Michael R
Bought by
Kelley Michael R and Kelley Emma R
Current Estimated Value
Home Financials for this Owner
Home Financials are based on the most recent Mortgage that was taken out on this home.
Original Mortgage
$120,000
Outstanding Balance
$84,592
Interest Rate
3%
Mortgage Type
New Conventional
Estimated Equity
$151,218
Purchase Details
Closed on
Jun 8, 2017
Sold by
Roberts Kenneth J and Roberts Yvonne A
Bought by
Kelly Michael Richard and Kelley Rhonda K
Home Financials for this Owner
Home Financials are based on the most recent Mortgage that was taken out on this home.
Original Mortgage
$124,000
Interest Rate
4%
Mortgage Type
New Conventional
Purchase Details
Closed on
Oct 19, 2004
Bought by
Roberts Kenneth J
Create a Home Valuation Report for This Property
The Home Valuation Report is an in-depth analysis detailing your home's value as well as a comparison with similar homes in the area
Home Values in the Area
Average Home Value in this Area
Purchase History
| Date | Buyer | Sale Price | Title Company |
|---|---|---|---|
| Kelley Michael R | -- | None Available | |
| Kelly Michael Richard | $156,000 | Murphysboro Abstract Co | |
| Roberts Kenneth J | $120,000 | -- |
Source: Public Records
Mortgage History
| Date | Status | Borrower | Loan Amount |
|---|---|---|---|
| Open | Kelley Michael R | $120,000 | |
| Previous Owner | Kelly Michael Richard | $124,000 |
Source: Public Records
Tax History Compared to Growth
Tax History
| Year | Tax Paid | Tax Assessment Tax Assessment Total Assessment is a certain percentage of the fair market value that is determined by local assessors to be the total taxable value of land and additions on the property. | Land | Improvement |
|---|---|---|---|---|
| 2024 | $6,251 | $67,414 | $4,156 | $63,258 |
| 2023 | $4,681 | $50,306 | $3,765 | $46,541 |
| 2022 | $4,508 | $46,442 | $3,476 | $42,966 |
| 2021 | $4,182 | $44,184 | $3,307 | $40,877 |
| 2020 | $4,119 | $44,967 | $3,366 | $41,601 |
| 2019 | $3,938 | $45,150 | $3,379 | $41,771 |
| 2018 | $3,975 | $47,115 | $3,526 | $43,589 |
| 2017 | $4,681 | $48,005 | $3,526 | $44,479 |
| 2016 | $3,570 | $48,005 | $3,526 | $44,479 |
| 2015 | -- | $49,948 | $3,526 | $46,422 |
| 2014 | -- | $49,948 | $3,526 | $46,422 |
| 2012 | -- | $50,967 | $3,598 | $47,369 |
Source: Public Records
Map
Nearby Homes
- 1408 Bobette Ln
- 1275 E Park St
- 1250 E Park St
- 69 High Ridge Rd
- 41 Mossy Oak Trail
- 1410 Bradford Ln
- 73 Upper Brush Hill Rd
- 000 E Meadowbrook Ln
- 701 E Campus Dr
- 000 E Campus Dr
- 580 Phillips Rd
- 102 Thomas Rd
- 000 W No Name Rd
- 1470 W No Name Rd
- 1414 E Walnut St
- 88 Dakota Rd
- 402 E Hester St Unit 14
- 405 E Mill St Unit 14
- 316 Lynda Dr
- 314 E Hester St