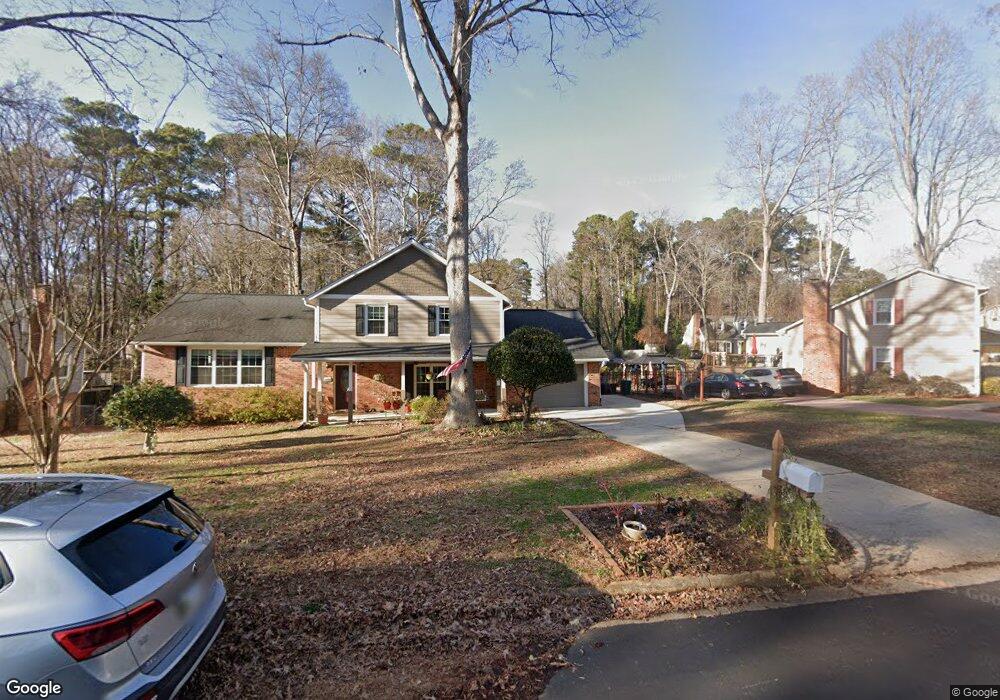
1504 Laughridge Dr Cary, NC 27511
South Cary NeighborhoodEstimated Value: $499,000 - $550,000
4
Beds
3
Baths
2,001
Sq Ft
$263/Sq Ft
Est. Value
About This Home
This home is located at 1504 Laughridge Dr, Cary, NC 27511 and is currently estimated at $525,369, approximately $262 per square foot. 1504 Laughridge Dr is a home located in Wake County with nearby schools including Briarcliff Elementary School, East Cary Middle School, and Cary High School.
Ownership History
Date
Name
Owned For
Owner Type
Purchase Details
Closed on
Feb 24, 2020
Sold by
Rosciano Jacqueline L and Suits Michael W
Bought by
Cluggish Ian and Cluggish Emily
Current Estimated Value
Home Financials for this Owner
Home Financials are based on the most recent Mortgage that was taken out on this home.
Original Mortgage
$254,925
Outstanding Balance
$176,944
Interest Rate
3.6%
Mortgage Type
New Conventional
Estimated Equity
$348,425
Purchase Details
Closed on
Jul 18, 2017
Sold by
Houghes Craig D and Hughes Doris R
Bought by
Rosciano Jacqueline I and Suits Michael W
Home Financials for this Owner
Home Financials are based on the most recent Mortgage that was taken out on this home.
Original Mortgage
$250,000
Interest Rate
3.89%
Mortgage Type
New Conventional
Purchase Details
Closed on
Oct 28, 1992
Bought by
Hughes Craig D and Hughes Doris R
Create a Home Valuation Report for This Property
The Home Valuation Report is an in-depth analysis detailing your home's value as well as a comparison with similar homes in the area
Home Values in the Area
Average Home Value in this Area
Purchase History
| Date | Buyer | Sale Price | Title Company |
|---|---|---|---|
| Cluggish Ian | $340,000 | None Available | |
| Rosciano Jacqueline I | $305,000 | None Available | |
| Hughes Craig D | $118,000 | -- |
Source: Public Records
Mortgage History
| Date | Status | Borrower | Loan Amount |
|---|---|---|---|
| Open | Cluggish Ian | $254,925 | |
| Previous Owner | Rosciano Jacqueline I | $250,000 |
Source: Public Records
Tax History Compared to Growth
Tax History
| Year | Tax Paid | Tax Assessment Tax Assessment Total Assessment is a certain percentage of the fair market value that is determined by local assessors to be the total taxable value of land and additions on the property. | Land | Improvement |
|---|---|---|---|---|
| 2025 | $4,052 | $470,435 | $210,000 | $260,435 |
| 2024 | $3,965 | $470,435 | $210,000 | $260,435 |
| 2023 | $3,217 | $319,046 | $135,000 | $184,046 |
| 2022 | $3,097 | $319,046 | $135,000 | $184,046 |
| 2021 | $3,035 | $319,046 | $135,000 | $184,046 |
| 2020 | $3,051 | $319,046 | $135,000 | $184,046 |
| 2019 | $2,787 | $258,440 | $108,000 | $150,440 |
| 2018 | $2,616 | $258,440 | $108,000 | $150,440 |
| 2017 | $2,514 | $258,440 | $108,000 | $150,440 |
| 2016 | $2,476 | $258,440 | $108,000 | $150,440 |
| 2015 | $2,130 | $214,315 | $76,000 | $138,315 |
| 2014 | $2,009 | $214,315 | $76,000 | $138,315 |
Source: Public Records
Map
Nearby Homes
- 1517 Laughridge Dr
- 109 Prince William Ln
- 300 Mainsail Dr
- 1215 Brookgreen Dr
- 203 Tapestry Terrace
- 115 Inverness Ct
- 1232 Dunnet Ct
- 105 Balzac Ct
- 129 Assembly Ct
- 205 Kingsmill Rd
- 303 Applecross Dr
- 607 Queensferry Rd
- 208 E Jules Verne Way
- 414 Applecross Dr
- 1103 Suterland Rd
- 1104 Suterland Rd
- 103 Lakeway Ct
- 501 Queensferry Rd
- 204 Brittany Place
- 101 Solway Ct
- 1506 Laughridge Dr
- 1502 Laughridge Dr
- 1430 Elgin Ct
- 1505 Laughridge Dr
- 1501 Laughridge Dr
- 1507 Laughridge Dr
- 1428 Elgin Ct
- 1117 Tarbert Ct
- 1510 Laughridge Dr
- 1427 Keith Ct
- 1509 Laughridge Dr
- 1426 Laughridge Dr
- 1425 Keith Ct
- 1511 Laughridge Dr
- 1119 Tarbert Ct
- 1427 Laughridge Dr
- 1426 Huntly Ct
- 1424 Laughridge Dr
- 1512 Laughridge Dr
- 1115 Tarbert Ct