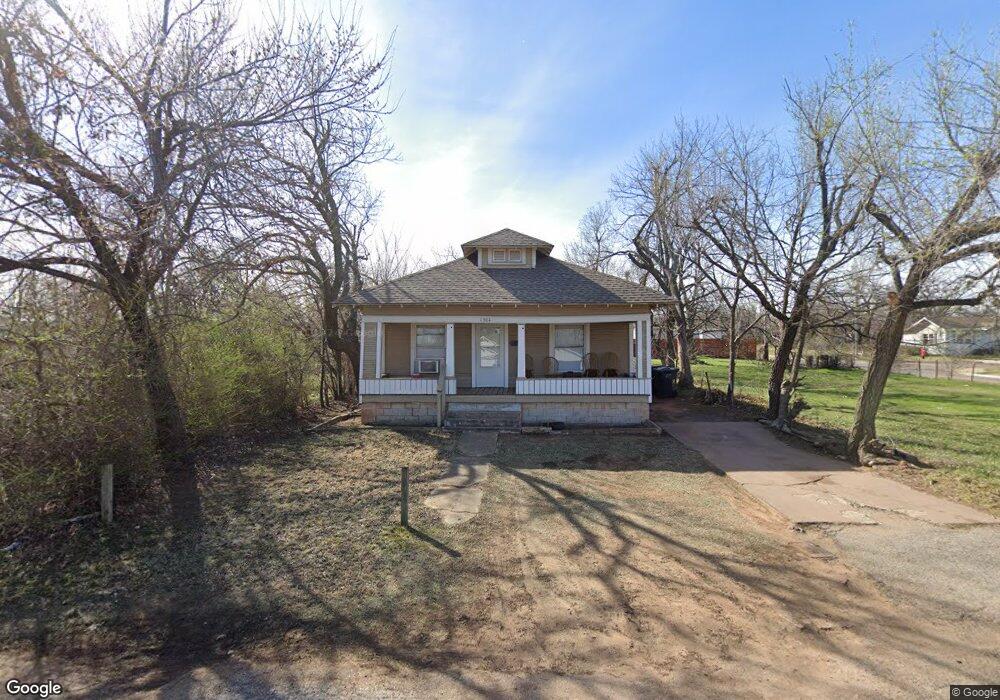
1504 NE 25th St Oklahoma City, OK 73111
Martin Luther King NeighborhoodEstimated Value: $81,000 - $119,000
2
Beds
1
Bath
1,030
Sq Ft
$98/Sq Ft
Est. Value
About This Home
This home is located at 1504 NE 25th St, Oklahoma City, OK 73111 and is currently estimated at $100,508, approximately $97 per square foot. 1504 NE 25th St is a home located in Oklahoma County with nearby schools including Thelma R. Parks Elementary School, Moon Middle School, and F.D. Moon Middle School.
Ownership History
Date
Name
Owned For
Owner Type
Purchase Details
Closed on
Jun 4, 2008
Sold by
Us Bank Na
Bought by
Holland Jay and Holland Christina
Current Estimated Value
Purchase Details
Closed on
Jan 14, 2008
Sold by
Tucker Darren H and Mortgage Electronic Registrati
Bought by
Us Bank Na and Lehman Brothers Structured Asset Investm
Purchase Details
Closed on
Apr 13, 2006
Sold by
Wytch Clayette and Wytch John
Bought by
Tucker Darren H
Home Financials for this Owner
Home Financials are based on the most recent Mortgage that was taken out on this home.
Original Mortgage
$43,500
Interest Rate
11.75%
Mortgage Type
Fannie Mae Freddie Mac
Purchase Details
Closed on
Apr 29, 2002
Sold by
Wytch Clayette
Bought by
Tucker Darren H
Purchase Details
Closed on
Jun 1, 2001
Sold by
Rak Properties Inc
Bought by
Wytch Clayette
Purchase Details
Closed on
Feb 27, 2001
Sold by
Lewis Kanzado and Jackson Clifford
Bought by
Rak Properties Inc
Create a Home Valuation Report for This Property
The Home Valuation Report is an in-depth analysis detailing your home's value as well as a comparison with similar homes in the area
Home Values in the Area
Average Home Value in this Area
Purchase History
| Date | Buyer | Sale Price | Title Company |
|---|---|---|---|
| Holland Jay | $13,500 | First American Title | |
| Us Bank Na | -- | None Available | |
| Tucker Darren H | -- | Oklahoma City Abstract & Tit | |
| Tucker Darren H | -- | -- | |
| Wytch Clayette | $8,000 | -- | |
| Rak Properties Inc | $7,000 | -- |
Source: Public Records
Mortgage History
| Date | Status | Borrower | Loan Amount |
|---|---|---|---|
| Previous Owner | Tucker Darren H | $43,500 |
Source: Public Records
Tax History Compared to Growth
Tax History
| Year | Tax Paid | Tax Assessment Tax Assessment Total Assessment is a certain percentage of the fair market value that is determined by local assessors to be the total taxable value of land and additions on the property. | Land | Improvement |
|---|---|---|---|---|
| 2024 | $422 | $3,610 | $316 | $3,294 |
| 2023 | $422 | $3,438 | $357 | $3,081 |
| 2022 | $385 | $3,274 | $357 | $2,917 |
| 2021 | $367 | $3,119 | $500 | $2,619 |
| 2020 | $354 | $2,971 | $372 | $2,599 |
| 2019 | $337 | $2,829 | $406 | $2,423 |
| 2018 | $306 | $2,695 | $0 | $0 |
| 2017 | $293 | $2,584 | $434 | $2,150 |
| 2016 | $299 | $2,639 | $434 | $2,205 |
| 2015 | $304 | $2,657 | $433 | $2,224 |
| 2014 | $288 | $2,530 | $434 | $2,096 |
Source: Public Records
Map
Nearby Homes
- 1516 NE 25th St
- 1437 Milam Ct
- 1439 Milam Ct
- 2421 N Prospect Ave
- 1433 NE 26th St
- 1504 NE 27th St
- 1500 NE 27th St
- 1435 NE 27th St
- 3000 N Fonshill Ave
- 2605 N Kate Ave
- 1400 NE 27th St
- 2221 N Jordan Ave
- 2301 N Kelham Ave
- 1419 NE 23rd St
- 2217 N Fonshill Ave
- 2201 N Prospect Ave
- 2145 N Bath Ave
- 2145 N Prospect Ave
- 2136 N Jordan Ave
- 2131 N Jordan Ave
- 1500 NE 25th St
- 1512 NE 25th St
- 1505 NE 24th St
- 1509 NE 24th St
- 1501 NE 24th St
- 1449 NE 25th St
- 1505 NE 25th St
- 1513 NE 24th St
- 1509 NE 25th St
- 1501 NE 25th St
- 2609 N Prospect Ave
- 1520 NE 25th St
- 1515 NE 25th St
- 1517 NE 24th St
- 1447 NE 25th St
- 1517 NE 25th St
- 1438 Monticello Ct
- 1446 NE 25th St
- 1521 NE 24th St
- 1442 Monticello Ct