Estimated Value: $191,000 - $200,000
3
Beds
2
Baths
1,319
Sq Ft
$148/Sq Ft
Est. Value
About This Home
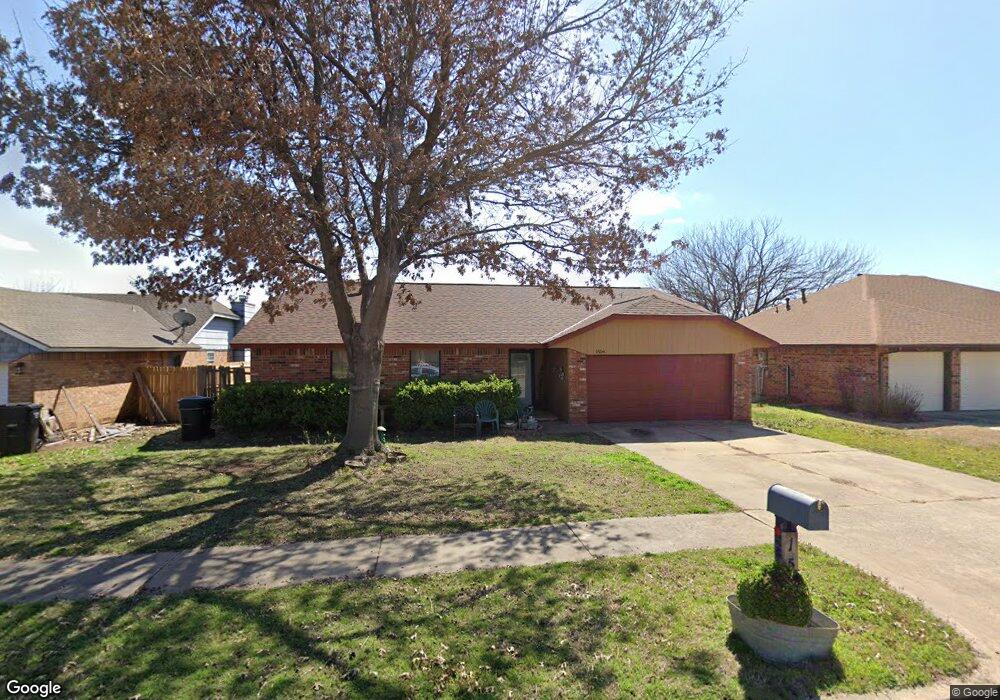
This home is located at 1504 NE 3rd St, Moore, OK 73160 and is currently estimated at $194,711, approximately $147 per square foot. 1504 NE 3rd St is a home located in Cleveland County with nearby schools including Winding Creek Elementary School, Central Junior High School, and Moore High School.
Ownership History
Date
Name
Owned For
Owner Type
Purchase Details
Closed on
Feb 23, 2011
Sold by
Secretary Of Housing & Urban Development
Bought by
Williams Rodney Earl
Current Estimated Value
Home Financials for this Owner
Home Financials are based on the most recent Mortgage that was taken out on this home.
Original Mortgage
$178,643
Outstanding Balance
$121,776
Interest Rate
4.7%
Mortgage Type
FHA
Estimated Equity
$72,935
Purchase Details
Closed on
May 14, 2010
Sold by
Cooper Kathleen S Timmons
Bought by
Secretary Of Housing & Urban Development
Purchase Details
Closed on
Dec 7, 2005
Sold by
Denson Brenda Renea and Mitchell Brenda
Bought by
Cooper Kathleen S Timmons
Home Financials for this Owner
Home Financials are based on the most recent Mortgage that was taken out on this home.
Original Mortgage
$90,578
Interest Rate
6.12%
Mortgage Type
FHA
Create a Home Valuation Report for This Property
The Home Valuation Report is an in-depth analysis detailing your home's value as well as a comparison with similar homes in the area
Home Values in the Area
Average Home Value in this Area
Purchase History
| Date | Buyer | Sale Price | Title Company |
|---|---|---|---|
| Williams Rodney Earl | -- | Heartland Title & Closing Ll | |
| Secretary Of Housing & Urban Development | -- | Fa | |
| Cooper Kathleen S Timmons | $920,000 | None Available |
Source: Public Records
Mortgage History
| Date | Status | Borrower | Loan Amount |
|---|---|---|---|
| Open | Williams Rodney Earl | $178,643 | |
| Previous Owner | Cooper Kathleen S Timmons | $90,578 |
Source: Public Records
Tax History Compared to Growth
Tax History
| Year | Tax Paid | Tax Assessment Tax Assessment Total Assessment is a certain percentage of the fair market value that is determined by local assessors to be the total taxable value of land and additions on the property. | Land | Improvement |
|---|---|---|---|---|
| 2024 | $1,522 | $13,548 | $2,913 | $10,635 |
| 2023 | $1,481 | $13,154 | $2,714 | $10,440 |
| 2022 | $1,456 | $12,771 | $2,933 | $9,838 |
| 2021 | $1,417 | $12,399 | $2,760 | $9,639 |
| 2020 | $1,418 | $12,399 | $2,760 | $9,639 |
| 2019 | $1,443 | $12,399 | $2,760 | $9,639 |
| 2018 | $1,444 | $12,399 | $2,760 | $9,639 |
| 2017 | $1,431 | $12,399 | $0 | $0 |
| 2016 | $1,397 | $11,891 | $2,647 | $9,244 |
| 2015 | $1,223 | $11,545 | $2,570 | $8,975 |
| 2014 | $1,212 | $11,208 | $1,366 | $9,842 |
Source: Public Records
Map
Nearby Homes
- 205 N Ramblin Oaks Dr
- 112 Wellington Ln
- 104 S Ramblin Oaks Dr
- 221 N English Dr
- 1200 NE 5th St
- 316 S Ramblin Oaks Dr
- 1809 Parkway Dr
- 609 Madeline Ln
- 401 S Bryant Ave
- 920 Elm Creek Dr
- 308 S Patterson Dr
- 901 N Avery Dr
- 417 S Bouziden Dr
- 1105 Oak Creek Dr
- 1824 NE 11th St
- 604 Loyd Ln
- 913 N Avery Dr
- 1401 NE 11th St
- 801 N Silver Leaf Dr
- 904 NE 4th St