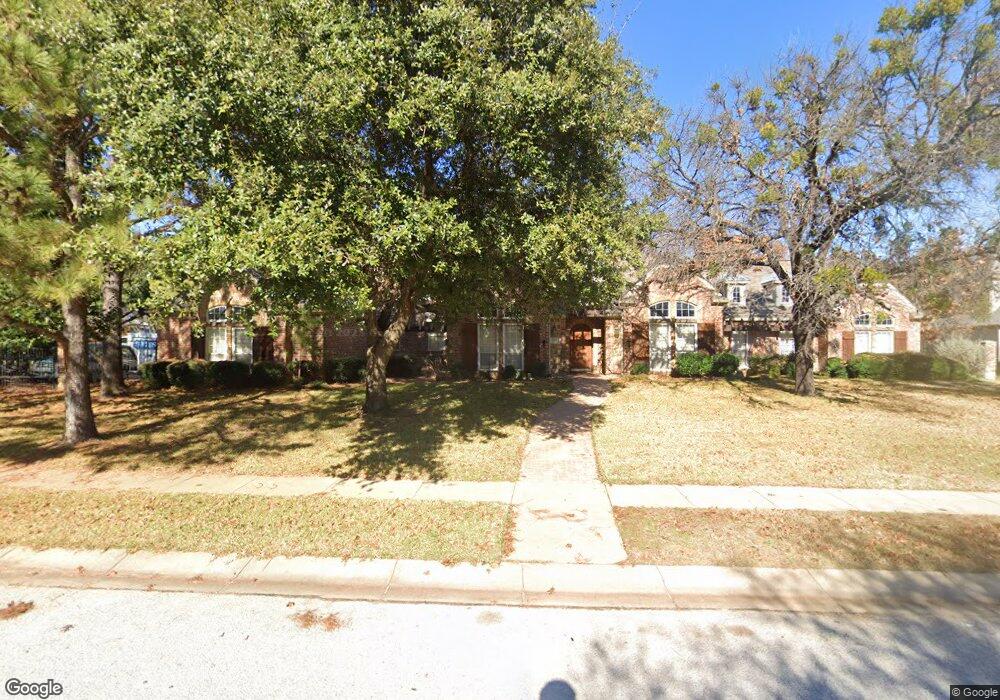
1504 New Castle Rd Southlake, TX 76092
Estimated Value: $1,801,000 - $2,012,000
5
Beds
4
Baths
4,847
Sq Ft
$392/Sq Ft
Est. Value
About This Home
This home is located at 1504 New Castle Rd, Southlake, TX 76092 and is currently estimated at $1,901,548, approximately $392 per square foot. 1504 New Castle Rd is a home located in Tarrant County with nearby schools including Don T. Durham Intermediate School, Walnut Grove Elementary School, and Carroll Middle School.
Ownership History
Date
Name
Owned For
Owner Type
Purchase Details
Closed on
May 5, 2003
Sold by
Ryno Valerie O
Bought by
Ryno J Jeff
Current Estimated Value
Purchase Details
Closed on
Dec 12, 2001
Sold by
Dissmore Enterpries Inc
Bought by
History Maker Homes Llc
Purchase Details
Closed on
Dec 11, 2001
Sold by
Southfork Development Ltd
Bought by
Dissmore Enterprises Inc
Purchase Details
Closed on
Feb 26, 1998
Sold by
Calais Construction Inc
Bought by
Ryno J Jeff and Ryno Valerie O
Purchase Details
Closed on
May 28, 1997
Sold by
Southlake Coventry Ltd
Bought by
Calais Construction Inc
Home Financials for this Owner
Home Financials are based on the most recent Mortgage that was taken out on this home.
Original Mortgage
$385,000
Interest Rate
8.1%
Create a Home Valuation Report for This Property
The Home Valuation Report is an in-depth analysis detailing your home's value as well as a comparison with similar homes in the area
Home Values in the Area
Average Home Value in this Area
Purchase History
| Date | Buyer | Sale Price | Title Company |
|---|---|---|---|
| Ryno J Jeff | -- | -- | |
| History Maker Homes Llc | -- | Safeco Land Title | |
| Dissmore Enterprises Inc | -- | Safeco Land Title | |
| Ryno J Jeff | -- | Commonwealth Land Title | |
| Calais Construction Inc | -- | Commonwealth Land Title |
Source: Public Records
Mortgage History
| Date | Status | Borrower | Loan Amount |
|---|---|---|---|
| Previous Owner | Calais Construction Inc | $385,000 |
Source: Public Records
Tax History Compared to Growth
Tax History
| Year | Tax Paid | Tax Assessment Tax Assessment Total Assessment is a certain percentage of the fair market value that is determined by local assessors to be the total taxable value of land and additions on the property. | Land | Improvement |
|---|---|---|---|---|
| 2025 | $12,513 | $1,383,560 | $431,820 | $951,740 |
| 2024 | $12,513 | $1,451,092 | $431,820 | $1,019,272 |
| 2023 | $21,944 | $1,611,000 | $431,820 | $1,179,180 |
| 2022 | $23,613 | $1,357,099 | $297,350 | $1,059,749 |
| 2021 | $22,686 | $995,000 | $297,350 | $697,650 |
| 2020 | $21,837 | $950,000 | $310,230 | $639,770 |
| 2019 | $22,907 | $950,000 | $310,230 | $639,770 |
| 2018 | $11,884 | $860,000 | $310,230 | $549,770 |
| 2017 | $20,038 | $808,427 | $172,350 | $636,077 |
| 2016 | $18,885 | $840,019 | $172,350 | $667,669 |
| 2015 | $17,533 | $692,650 | $86,250 | $606,400 |
| 2014 | $17,533 | $722,100 | $86,250 | $635,850 |
Source: Public Records
Map
Nearby Homes
- 1805 Leeds Dr
- 1161 La Mirada
- 1402 Thetford Ct
- 1900 Shady Oaks Dr
- 1425 N Peytonville Ave
- 935 W Dove Rd
- 914 Turnberry Ln
- 1285 Shady Oaks Dr
- 1275 Shady Oaks Dr
- 501 Fox Glen
- 1052 W Dove Rd
- 2201 Shady Oaks Dr
- 1633 Mockingbird Ln
- 904 Charleston Dr
- 2009 Wheeler Dr
- 912 Berkshire Rd
- 112 Murphy Dr
- 200 Murphy Dr
- 104 Murano
- 1567 Dove Rd
- 1502 New Castle Rd
- 1506 New Castle Rd
- 1801 Lantana Ct
- 1800 Lantana Ct
- 1505 New Castle Rd
- 1507 New Castle Rd
- 1503 New Castle Rd
- 1800 Leeds Dr
- 1500 New Castle Rd
- 1802 Lantana Ct
- 1803 Lantana Ct
- 1508 New Castle Rd
- 1508 Norwich Ct
- 1506 Norwich Ct
- 1802 Leeds Dr
- 1510 Norwich Ct
- 1509 New Castle Rd
- 1501 New Castle Rd
- 1504 Norwich Ct
- 1804 Lantana Ct