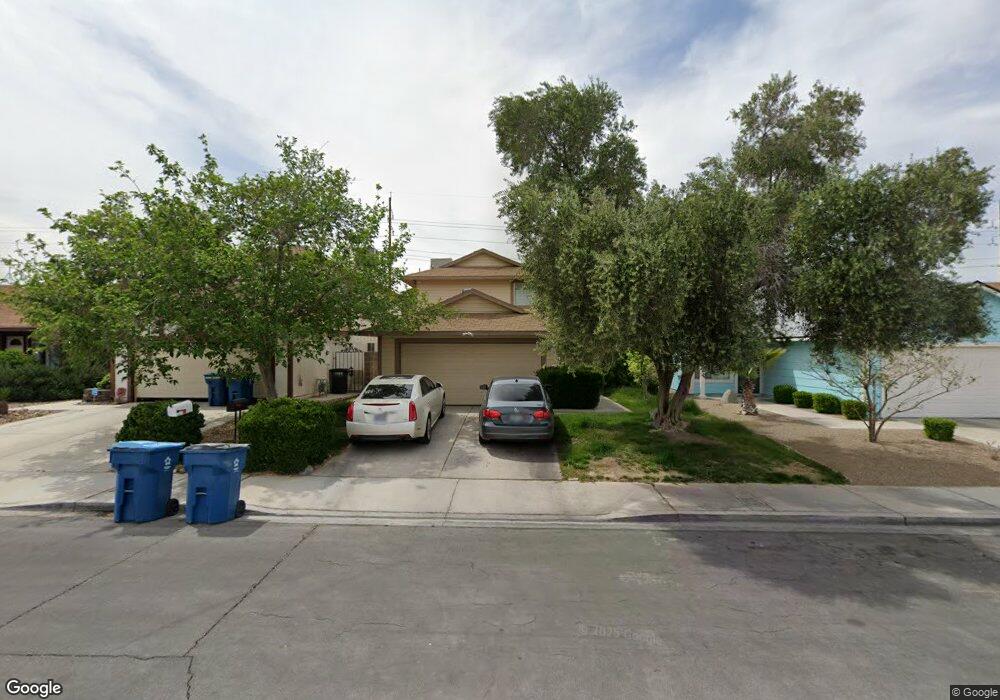
1504 Wheatland Way Las Vegas, NV 89128
Pioneer Park NeighborhoodEstimated Value: $342,000 - $388,000
3
Beds
2
Baths
1,508
Sq Ft
$245/Sq Ft
Est. Value
About This Home
This home is located at 1504 Wheatland Way, Las Vegas, NV 89128 and is currently estimated at $369,580, approximately $245 per square foot. 1504 Wheatland Way is a home located in Clark County with nearby schools including James B. McMillan Elementary School, Edythe & Lloyd Katz Elementary School, and Ernest Becker Middle School.
Ownership History
Date
Name
Owned For
Owner Type
Purchase Details
Closed on
Jul 21, 2014
Sold by
Tanner Paula and Tanner Paula
Bought by
Tanner Thomas R and Tanner T
Current Estimated Value
Purchase Details
Closed on
Jul 17, 2011
Sold by
Williamson James
Bought by
Williamson James and Tanner Paula
Purchase Details
Closed on
Mar 2, 2004
Sold by
Shuda Michael J
Bought by
Williamson James
Purchase Details
Closed on
Feb 27, 1997
Sold by
Shuda Michael J and Shuda Sandra L
Bought by
Shuda Michael J
Home Financials for this Owner
Home Financials are based on the most recent Mortgage that was taken out on this home.
Original Mortgage
$113,181
Interest Rate
7.86%
Mortgage Type
FHA
Purchase Details
Closed on
Feb 20, 1997
Sold by
Smith Robert A and Smith Rosemary M
Bought by
Shuda Michael J
Home Financials for this Owner
Home Financials are based on the most recent Mortgage that was taken out on this home.
Original Mortgage
$113,181
Interest Rate
7.86%
Mortgage Type
FHA
Create a Home Valuation Report for This Property
The Home Valuation Report is an in-depth analysis detailing your home's value as well as a comparison with similar homes in the area
Home Values in the Area
Average Home Value in this Area
Purchase History
| Date | Buyer | Sale Price | Title Company |
|---|---|---|---|
| Tanner Thomas R | -- | Fidelity National Title | |
| -- | -- | Fidelity National Title | |
| Williamson James | -- | None Available | |
| Williamson James | $124,000 | United Title Of Nevada | |
| Shuda Michael J | -- | Land Title | |
| Shuda Michael J | $114,500 | Land Title |
Source: Public Records
Mortgage History
| Date | Status | Borrower | Loan Amount |
|---|---|---|---|
| Previous Owner | Shuda Michael J | $113,181 |
Source: Public Records
Tax History Compared to Growth
Tax History
| Year | Tax Paid | Tax Assessment Tax Assessment Total Assessment is a certain percentage of the fair market value that is determined by local assessors to be the total taxable value of land and additions on the property. | Land | Improvement |
|---|---|---|---|---|
| 2025 | $1,195 | $63,494 | $29,750 | $33,744 |
| 2024 | $1,107 | $63,494 | $29,750 | $33,744 |
| 2023 | $1,107 | $61,146 | $28,350 | $32,796 |
| 2022 | $1,075 | $53,130 | $22,750 | $30,380 |
| 2021 | $996 | $49,932 | $20,650 | $29,282 |
| 2020 | $964 | $49,373 | $19,950 | $29,423 |
| 2019 | $952 | $45,688 | $16,450 | $29,238 |
| 2018 | $909 | $43,366 | $15,050 | $28,316 |
| 2017 | $1,409 | $42,979 | $14,000 | $28,979 |
| 2016 | $862 | $39,301 | $9,800 | $29,501 |
| 2015 | $860 | $36,966 | $8,750 | $28,216 |
| 2014 | $834 | $26,540 | $5,250 | $21,290 |
Source: Public Records
Map
Nearby Homes
- 7228 Single Pine Dr
- 7224 Single Pine Dr
- 1320 Rainbow Meadows Dr
- 1533 Wintergreen Dr
- 7405 Saybrook Point Dr
- 7037 Brown Derby Cir
- 1636 Royal Palm Dr
- 1624 Leaning Pine Way
- 7104 Carmen Blvd
- 1620 Palmae Way
- 7321 Summer Sun Dr
- 7400 Queen Palm Dr
- 7113 Carrondale Way
- 7424 Queen Palm Dr
- 1428 Pacific Terrace Dr
- 1105 Olvera Way
- 1317 Pacific Terrace Dr
- 7501 Moon Shower Cir
- 1724 Navajo Lake Way
- 1009 Pagosa Way
- 1508 Wheatland Way
- 1500 Wheatland Way
- 1512 Wheatland Way
- 1416 Wheatland Way
- 1516 Wheatland Way
- 1505 Wheatland Way
- 1520 Wheatland Way
- 1408 Wheatland Way
- 1501 Wheatland Way Unit n/a
- 1501 Wheatland Way
- 1509 Wheatland Way
- 1417 Wheatland Way
- 1513 Wheatland Way
- 1413 Rainbow Meadows Dr
- 1501 Rainbow Meadows Dr
- 1404 Wheatland Way
- 1413 Wheatland Way
- 1517 Wheatland Way
- 1524 Wheatland Way