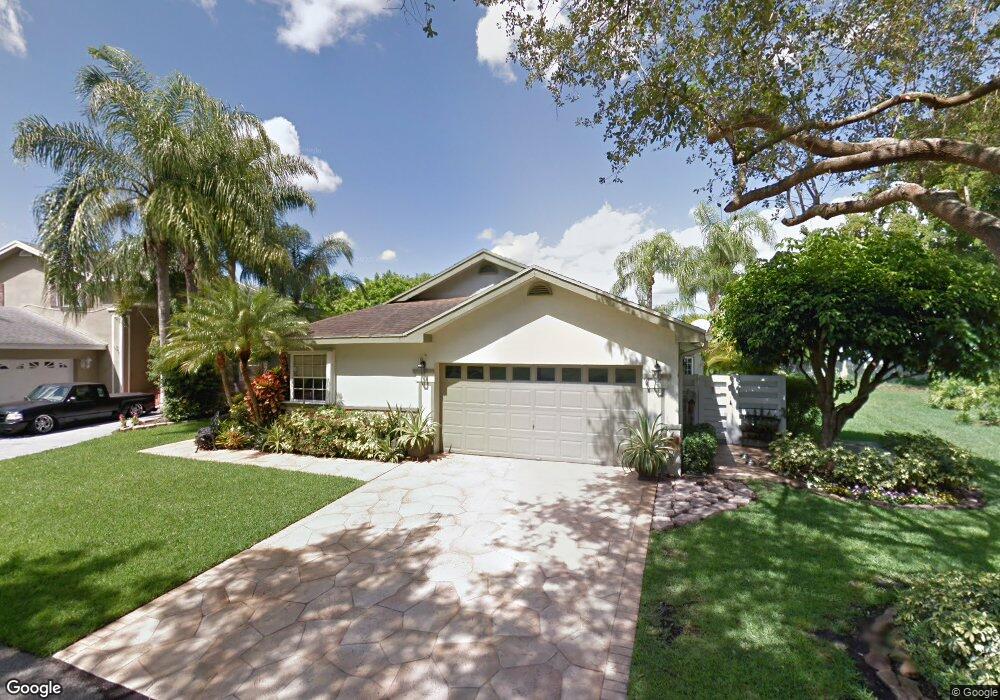
15045 SW 138th Place Miami, FL 33186
Country Walk NeighborhoodEstimated Value: $602,000 - $635,973
3
Beds
2
Baths
1,748
Sq Ft
$350/Sq Ft
Est. Value
About This Home
This home is located at 15045 SW 138th Place, Miami, FL 33186 and is currently estimated at $611,493, approximately $349 per square foot. 15045 SW 138th Place is a home located in Miami-Dade County with nearby schools including Jack D. Gordon Elementary School, Jorge Mas Canosa Middle School, and Arthur And Polly Mays Conservatory Of The Arts.
Ownership History
Date
Name
Owned For
Owner Type
Purchase Details
Closed on
Oct 8, 2021
Sold by
Rendon Eileen and Watson Jofin Douglas
Bought by
Rendon Eileen and Watson Sean D
Current Estimated Value
Purchase Details
Closed on
Feb 17, 2003
Sold by
Rendon Eileen and Watson John Douglas
Bought by
Rendon Eileen
Purchase Details
Closed on
Jul 31, 1998
Sold by
Rendon Eileen and Watson John D
Bought by
Rendon Eileen and Watson John D
Home Financials for this Owner
Home Financials are based on the most recent Mortgage that was taken out on this home.
Original Mortgage
$31,250
Outstanding Balance
$6,531
Interest Rate
6.94%
Mortgage Type
New Conventional
Estimated Equity
$604,962
Purchase Details
Closed on
Nov 24, 1993
Sold by
Kenny Mary N and Mitchell Mary N
Bought by
Rendon Eileen
Home Financials for this Owner
Home Financials are based on the most recent Mortgage that was taken out on this home.
Original Mortgage
$98,600
Interest Rate
6.81%
Create a Home Valuation Report for This Property
The Home Valuation Report is an in-depth analysis detailing your home's value as well as a comparison with similar homes in the area
Home Values in the Area
Average Home Value in this Area
Purchase History
| Date | Buyer | Sale Price | Title Company |
|---|---|---|---|
| Rendon Eileen | -- | None Available | |
| Rendon Eileen | -- | -- | |
| Rendon Eileen | $31,250 | -- | |
| Rendon Eileen | $116,000 | -- |
Source: Public Records
Mortgage History
| Date | Status | Borrower | Loan Amount |
|---|---|---|---|
| Open | Rendon Eileen | $31,250 | |
| Previous Owner | Rendon Eileen | $98,600 |
Source: Public Records
Tax History Compared to Growth
Tax History
| Year | Tax Paid | Tax Assessment Tax Assessment Total Assessment is a certain percentage of the fair market value that is determined by local assessors to be the total taxable value of land and additions on the property. | Land | Improvement |
|---|---|---|---|---|
| 2025 | $3,180 | $192,157 | -- | -- |
| 2024 | $2,954 | $186,742 | -- | -- |
| 2023 | $2,954 | $181,303 | $0 | $0 |
| 2022 | $2,822 | $176,023 | $0 | $0 |
| 2021 | $2,788 | $170,897 | $0 | $0 |
| 2020 | $2,755 | $168,538 | $0 | $0 |
| 2019 | $2,694 | $164,749 | $0 | $0 |
| 2018 | $2,560 | $161,678 | $0 | $0 |
| 2017 | $2,536 | $158,353 | $0 | $0 |
| 2016 | $2,502 | $155,096 | $0 | $0 |
| 2015 | $2,528 | $154,018 | $0 | $0 |
| 2014 | $2,556 | $152,796 | $0 | $0 |
Source: Public Records
Map
Nearby Homes
- 15016 SW 139th Place
- 15004 SW 139th Place
- 13951 SW 152nd Terrace
- 14823 SW 139th Ct
- 15101 SW 136th Place
- 13766 SW 147th Cir Ln Unit 1-20
- 15502 SW 137th Place
- 15025 SW 141st Ct
- 15563 SW 137th Place
- 13790 SW 147th Circle Ln Unit 29
- 14807 SW 140th Ct
- 14121 SW 152nd Terrace
- 13748 SW 155th Terrace
- 14027 SW 155th St
- 14512 SW 138th Ct
- 14213 SW 152nd Terrace
- 13829 SW 157th Terrace
- 14502 SW 138th Ave
- 14478 SW 139th Avenue Cir W
- 13870 SW 157th Terrace
- 15035 SW 138th Place
- 15055 SW 138th Place
- 15025 SW 138th Place
- 15107 SW 138th Place
- 13873 SW 151st Ln
- 15015 SW 138th Place
- 13877 SW 151st Ln
- 15119 SW 138th Place
- 13842 SW 151st Ave
- 15021 SW 139th Ave
- 15005 SW 138th Place
- 13881 SW 151st Ln
- 13866 SW 151st Ln
- 13885 SW 151st Ln
- 14955 SW 139th Ave
- 13870 SW 151st Ln
- 13874 SW 151st Ln
- XXXX SW Xxxx
- 14941 SW 139th Ave
- 13882 SW 151st Ln