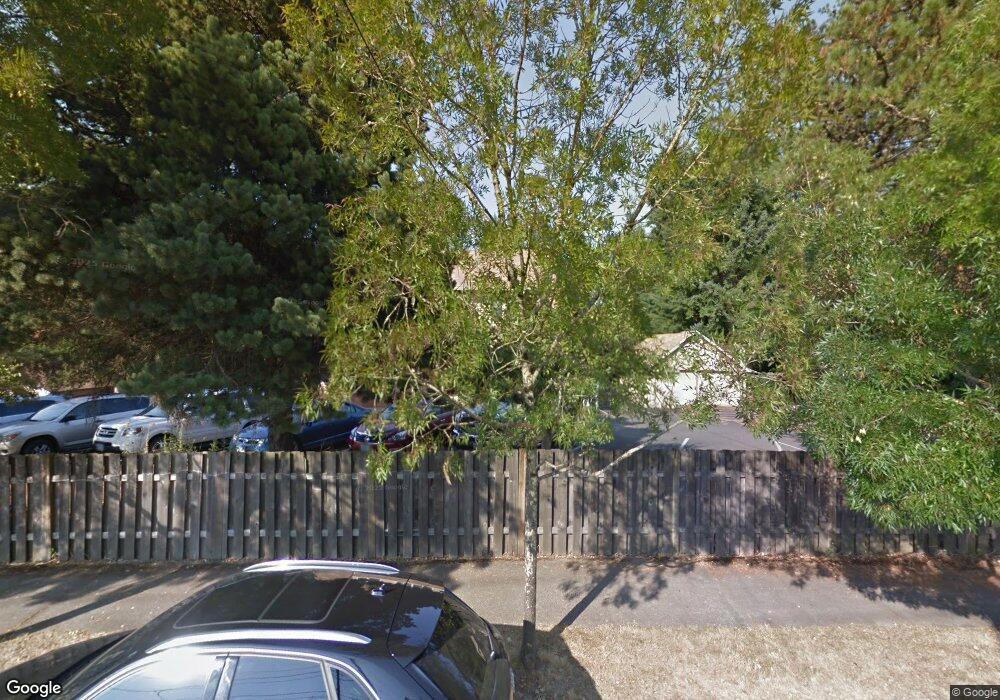
1505 12th St Oregon City, OR 97045
McLoughlin NeighborhoodEstimated Value: $647,000 - $817,248
6
Beds
3
Baths
3,612
Sq Ft
$193/Sq Ft
Est. Value
About This Home
This home is located at 1505 12th St, Oregon City, OR 97045 and is currently estimated at $698,062, approximately $193 per square foot. 1505 12th St is a home located in Clackamas County with nearby schools including Holcomb Elementary School, Tumwata Middle School, and Oregon City Senior High School.
Ownership History
Date
Name
Owned For
Owner Type
Purchase Details
Closed on
Jul 19, 2018
Sold by
Oregon City School District No 62
Bought by
Nixon Joel A and Austin Cara L
Current Estimated Value
Home Financials for this Owner
Home Financials are based on the most recent Mortgage that was taken out on this home.
Original Mortgage
$312,480
Outstanding Balance
$271,409
Interest Rate
4.6%
Mortgage Type
New Conventional
Estimated Equity
$426,653
Purchase Details
Closed on
Feb 6, 1998
Sold by
Lyman Frances Bauer
Bought by
Lyman A H
Create a Home Valuation Report for This Property
The Home Valuation Report is an in-depth analysis detailing your home's value as well as a comparison with similar homes in the area
Home Values in the Area
Average Home Value in this Area
Purchase History
| Date | Buyer | Sale Price | Title Company |
|---|---|---|---|
| Nixon Joel A | $390,600 | First American Title | |
| Lyman A H | -- | First American Title Ins Co |
Source: Public Records
Mortgage History
| Date | Status | Borrower | Loan Amount |
|---|---|---|---|
| Open | Nixon Joel A | $312,480 |
Source: Public Records
Tax History Compared to Growth
Tax History
| Year | Tax Paid | Tax Assessment Tax Assessment Total Assessment is a certain percentage of the fair market value that is determined by local assessors to be the total taxable value of land and additions on the property. | Land | Improvement |
|---|---|---|---|---|
| 2024 | $9,054 | $483,688 | -- | -- |
| 2023 | $9,054 | $469,600 | $0 | $0 |
| 2022 | $8,330 | $455,923 | $0 | $0 |
| 2021 | $7,995 | $442,644 | $0 | $0 |
| 2020 | $7,767 | $429,752 | $0 | $0 |
| 2019 | $7,602 | $417,235 | $0 | $0 |
| 2018 | $0 | $397,523 | $0 | $0 |
| 2017 | $0 | $342,066 | $0 | $0 |
| 2016 | -- | $332,103 | $0 | $0 |
| 2015 | -- | $322,430 | $0 | $0 |
| 2014 | -- | $313,039 | $0 | $0 |
Source: Public Records
Map
Nearby Homes