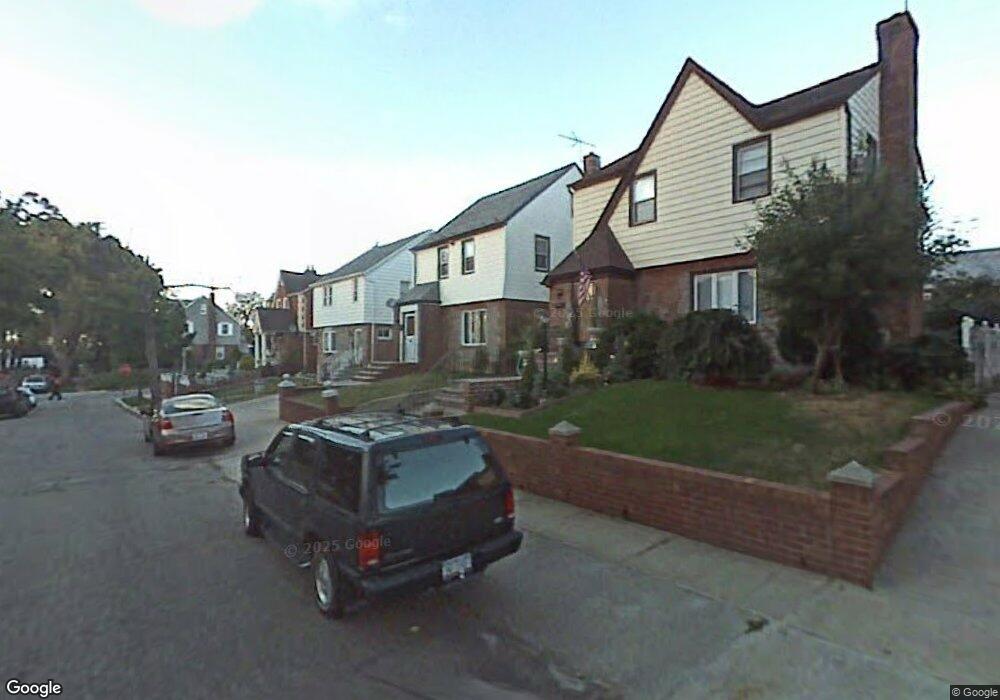
1505 145th Place Whitestone, NY 11357
Whitestone NeighborhoodEstimated Value: $1,138,533 - $1,285,000
--
Bed
--
Bath
2,236
Sq Ft
$544/Sq Ft
Est. Value
About This Home
This home is located at 1505 145th Place, Whitestone, NY 11357 and is currently estimated at $1,216,133, approximately $543 per square foot. 1505 145th Place is a home located in Queens County with nearby schools including Flushing High School, Holy Trinity School, and St Lukes School.
Ownership History
Date
Name
Owned For
Owner Type
Purchase Details
Closed on
Sep 19, 2022
Sold by
Mui Sandy
Bought by
Liang Gatian and Mui Sandy
Current Estimated Value
Home Financials for this Owner
Home Financials are based on the most recent Mortgage that was taken out on this home.
Original Mortgage
$450,000
Outstanding Balance
$429,505
Interest Rate
5.13%
Mortgage Type
Purchase Money Mortgage
Estimated Equity
$786,628
Purchase Details
Closed on
Mar 3, 2010
Sold by
Dimaria Denise and Dimaria Frank
Bought by
Mui Sandy
Home Financials for this Owner
Home Financials are based on the most recent Mortgage that was taken out on this home.
Original Mortgage
$330,000
Interest Rate
5.02%
Mortgage Type
Purchase Money Mortgage
Purchase Details
Closed on
Aug 14, 1996
Sold by
Rupprecht John and Rupprecht Frieda
Bought by
Demaria Frank and Dimaria Denise
Home Financials for this Owner
Home Financials are based on the most recent Mortgage that was taken out on this home.
Original Mortgage
$198,000
Interest Rate
7.83%
Create a Home Valuation Report for This Property
The Home Valuation Report is an in-depth analysis detailing your home's value as well as a comparison with similar homes in the area
Home Values in the Area
Average Home Value in this Area
Purchase History
| Date | Buyer | Sale Price | Title Company |
|---|---|---|---|
| Liang Gatian | -- | -- | |
| Mui Sandy | $765,000 | -- | |
| Demaria Frank | $247,500 | Pioneer Land Title Corp |
Source: Public Records
Mortgage History
| Date | Status | Borrower | Loan Amount |
|---|---|---|---|
| Open | Liang Gatian | $450,000 | |
| Closed | Mui Sandy | $330,000 | |
| Previous Owner | Demaria Frank | $198,000 |
Source: Public Records
Tax History Compared to Growth
Tax History
| Year | Tax Paid | Tax Assessment Tax Assessment Total Assessment is a certain percentage of the fair market value that is determined by local assessors to be the total taxable value of land and additions on the property. | Land | Improvement |
|---|---|---|---|---|
| 2025 | $11,677 | $58,579 | $13,392 | $45,187 |
| 2024 | $11,677 | $58,139 | $14,158 | $43,981 |
| 2023 | $11,016 | $54,848 | $11,326 | $43,522 |
| 2022 | $10,330 | $71,100 | $15,240 | $55,860 |
| 2021 | $10,273 | $76,080 | $15,240 | $60,840 |
| 2020 | $10,333 | $66,240 | $15,240 | $51,000 |
| 2019 | $10,135 | $64,140 | $15,240 | $48,900 |
| 2018 | $9,317 | $45,707 | $11,427 | $34,280 |
| 2017 | $8,790 | $43,120 | $12,036 | $31,084 |
| 2016 | $8,132 | $43,120 | $12,036 | $31,084 |
| 2015 | $4,906 | $40,680 | $14,322 | $26,358 |
| 2014 | $4,906 | $40,375 | $14,376 | $25,999 |
Source: Public Records
Map
Nearby Homes
- 145-04 14th Ave
- 147-20 17th Ave
- 16-12 149th St
- 1535 149th St
- 1527 149th St
- 19-05 147th St
- 14-18 143rd St
- 14915 15th Rd
- 12-39 148th St
- 12-35 148th St
- 147-16 20th Ave
- 20-21 Parsons Blvd
- 149-11 19th Ave
- 145-52 10th Ave
- 145-04 21st Ave
- 21-12 144th St
- 14-33 140th St
- 915 Malba Dr
- 14703 10th Ave
- 141-37 11th Ave
- 1511 145th Place
- 1501 145th Place
- 1511 145th Place
- 15-11 145th Place
- 1515 145th Place
- 1506 146th St
- 1510 146th St
- 1519 145th Place
- 1514 146th St
- 15-26 145th Place
- 1506 145th Place
- 1431 145th Place
- 1523 145th Place
- 145-45 15th Ave
- 1510 145th Place
- 1502 145th Place
- 15-30 145th Place
- 1518 146th St
- 1514 145th Place
- 15-34 146th St