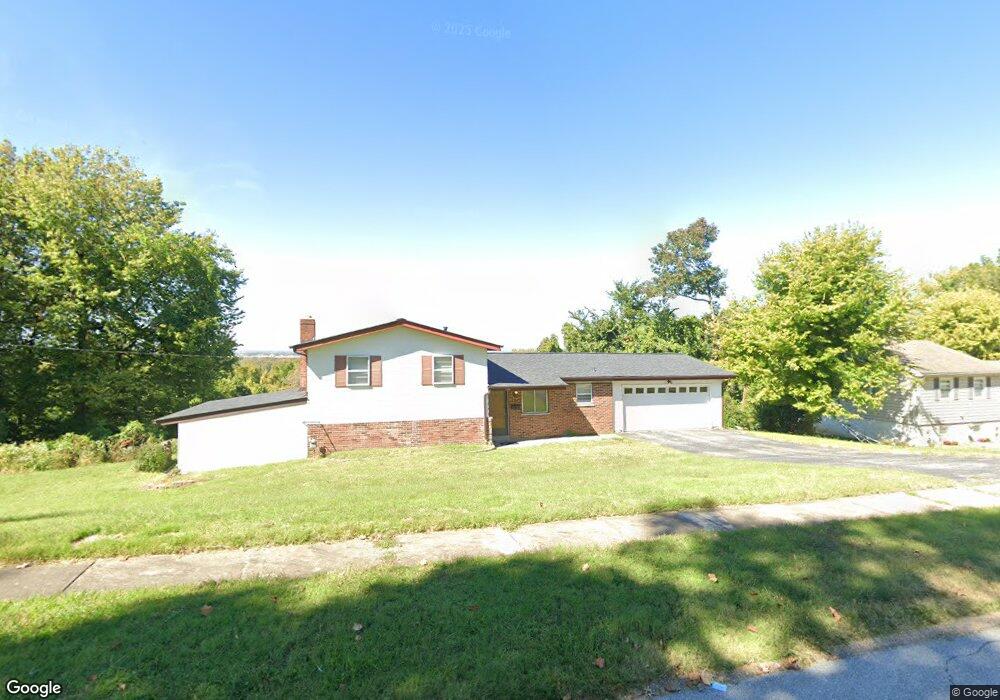
1505 Bluff Dr Florissant, MO 63031
Estimated Value: $169,000 - $207,947
3
Beds
2
Baths
1,096
Sq Ft
$167/Sq Ft
Est. Value
About This Home
This home is located at 1505 Bluff Dr, Florissant, MO 63031 and is currently estimated at $183,487, approximately $167 per square foot. 1505 Bluff Dr is a home located in St. Louis County with nearby schools including Lusher Elementary School, Northwest Middle School, and Hazelwood West High School.
Ownership History
Date
Name
Owned For
Owner Type
Purchase Details
Closed on
Jun 26, 2018
Sold by
Aldrich Albert R and Aldrich Ellen
Bought by
Aldrich Alan R
Current Estimated Value
Home Financials for this Owner
Home Financials are based on the most recent Mortgage that was taken out on this home.
Original Mortgage
$101,139
Outstanding Balance
$88,409
Interest Rate
4.99%
Mortgage Type
FHA
Estimated Equity
$95,078
Purchase Details
Closed on
May 29, 2009
Sold by
Aldrich Albert R
Bought by
Aldrich Ellen
Purchase Details
Closed on
Apr 11, 2008
Sold by
Findley David A and Findley Jeanette E
Bought by
Aldrich Albert R
Purchase Details
Closed on
Jul 17, 2003
Sold by
Findley David A and Findley Jeanette E
Bought by
Findley David A and Findley Jeanette E
Create a Home Valuation Report for This Property
The Home Valuation Report is an in-depth analysis detailing your home's value as well as a comparison with similar homes in the area
Home Values in the Area
Average Home Value in this Area
Purchase History
| Date | Buyer | Sale Price | Title Company |
|---|---|---|---|
| Aldrich Alan R | -- | Investors Title Company | |
| Aldrich Ellen | -- | None Available | |
| Aldrich Albert R | $149,000 | Archway Title Agency Inc | |
| Findley David A | -- | -- |
Source: Public Records
Mortgage History
| Date | Status | Borrower | Loan Amount |
|---|---|---|---|
| Open | Aldrich Alan R | $101,139 |
Source: Public Records
Tax History Compared to Growth
Tax History
| Year | Tax Paid | Tax Assessment Tax Assessment Total Assessment is a certain percentage of the fair market value that is determined by local assessors to be the total taxable value of land and additions on the property. | Land | Improvement |
|---|---|---|---|---|
| 2025 | $2,666 | $34,390 | $9,100 | $25,290 |
| 2024 | $2,666 | $29,840 | $5,230 | $24,610 |
| 2023 | $2,663 | $29,840 | $5,230 | $24,610 |
| 2022 | $2,430 | $24,260 | $6,780 | $17,480 |
| 2021 | $2,366 | $24,260 | $6,780 | $17,480 |
| 2020 | $2,257 | $21,740 | $5,800 | $15,940 |
| 2019 | $2,223 | $21,740 | $5,800 | $15,940 |
| 2018 | $2,253 | $20,270 | $4,670 | $15,600 |
| 2017 | $2,250 | $20,270 | $4,670 | $15,600 |
| 2016 | $2,290 | $20,350 | $5,070 | $15,280 |
| 2015 | $2,241 | $20,350 | $5,070 | $15,280 |
| 2014 | $2,004 | $18,730 | $4,750 | $13,980 |
Source: Public Records
Map
Nearby Homes
- 1767 Stilton Ct
- 2 Berwick at River Bluffs Manors
- 2 Ashford at River Bluffs Manors
- 2 Meadows
- 2 Meadows
- 2 Maple at River Bluffs Manors
- 1834 Night Dr
- 2 Royal II at River Bluffs Manors
- 2 Aspen II at River Bluffs Manors
- 2 Sterling at River Bluffs Manors
- 2216 Foggy Bottom Dr
- 2 Aspen at River Bluffs Manors Unit Aspen at River Bluff
- 2490 Mullanphy Ln
- 2 Fieldcrest at River Bluffs Meadows
- 2171 Farthing Ct
- 2 Belmont at River Bluffs Meadows
- 2347 Farflung Dr
- 2 Carolina at River Bluffs Meadows
- 2145 Flamingo Dr
- 2305 Teakwood Manor Dr
- 1525 Bluff Dr
- 1520 Bluff Dr
- 1500 Bluff Dr
- 1535 Bluff Dr
- 1530 Bluff Dr
- 2780 Flamingo Dr
- 2775 Flamingo Dr
- 1545 Bluff Dr
- 2780 Mockingbird Ln
- 2760 Flamingo Dr
- 2755 Flamingo Dr
- 1555 Bluff Dr
- 2770 Mockingbird Ln
- 2750 Flamingo Dr
- 1550 Bluff Dr
- 2745 Flamingo Dr
- 1565 Bluff Dr
- 2775 Mockingbird Ln
- 2750 Mockingbird Ln
- 2730 Flamingo Dr