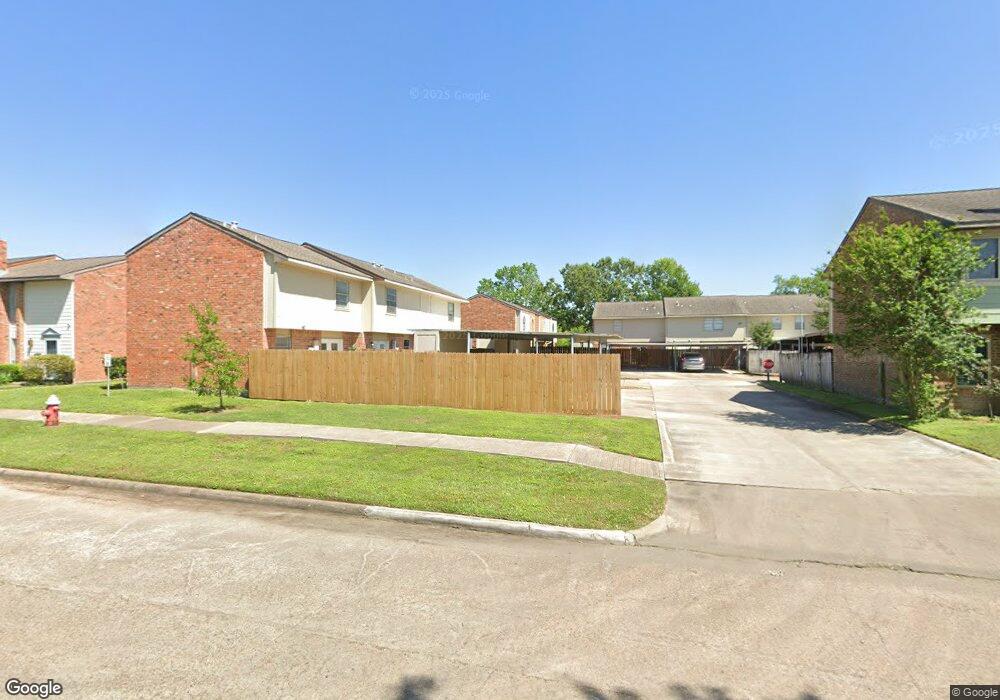
1505 Bonanza Rd Unit 1 Houston, TX 77062
Clear Lake NeighborhoodEstimated Value: $124,281 - $158,000
2
Beds
2
Baths
960
Sq Ft
$150/Sq Ft
Est. Value
About This Home
This home is located at 1505 Bonanza Rd Unit 1, Houston, TX 77062 and is currently estimated at $144,320, approximately $150 per square foot. 1505 Bonanza Rd Unit 1 is a home located in Harris County with nearby schools including Falcon Pass Elementary School, Space Center Intermediate, and Clear Lake High School.
Ownership History
Date
Name
Owned For
Owner Type
Purchase Details
Closed on
Sep 30, 2019
Sold by
Cox Thomas R and Cox Roberta P
Bought by
Posada Seth Alexander
Current Estimated Value
Home Financials for this Owner
Home Financials are based on the most recent Mortgage that was taken out on this home.
Original Mortgage
$90,824
Outstanding Balance
$79,566
Interest Rate
3.5%
Mortgage Type
FHA
Estimated Equity
$64,754
Purchase Details
Closed on
Jun 29, 2010
Sold by
Calisse Fabrizio
Bought by
Cox Raymond T and Cox Thomas R
Home Financials for this Owner
Home Financials are based on the most recent Mortgage that was taken out on this home.
Original Mortgage
$75,976
Interest Rate
4.81%
Mortgage Type
FHA
Purchase Details
Closed on
Apr 11, 2001
Sold by
Purdy Kenton Edward
Bought by
Calisse Fabrizio
Create a Home Valuation Report for This Property
The Home Valuation Report is an in-depth analysis detailing your home's value as well as a comparison with similar homes in the area
Home Values in the Area
Average Home Value in this Area
Purchase History
| Date | Buyer | Sale Price | Title Company |
|---|---|---|---|
| Posada Seth Alexander | -- | Alamo Title Company | |
| Cox Raymond T | -- | Stewart Title Houston Div | |
| Calisse Fabrizio | -- | Commonwealth Title |
Source: Public Records
Mortgage History
| Date | Status | Borrower | Loan Amount |
|---|---|---|---|
| Open | Posada Seth Alexander | $90,824 | |
| Previous Owner | Cox Raymond T | $75,976 |
Source: Public Records
Tax History Compared to Growth
Tax History
| Year | Tax Paid | Tax Assessment Tax Assessment Total Assessment is a certain percentage of the fair market value that is determined by local assessors to be the total taxable value of land and additions on the property. | Land | Improvement |
|---|---|---|---|---|
| 2025 | $3,403 | $135,869 | $25,815 | $110,054 |
| 2024 | $3,403 | $144,986 | $27,547 | $117,439 |
| 2023 | $3,403 | $158,704 | $30,154 | $128,550 |
| 2022 | $2,944 | $120,486 | $22,892 | $97,594 |
| 2021 | $3,134 | $121,636 | $23,111 | $98,525 |
| 2020 | $2,907 | $105,147 | $19,978 | $85,169 |
| 2019 | $3,042 | $105,147 | $19,978 | $85,169 |
| 2018 | $1,136 | $92,832 | $17,638 | $75,194 |
| 2017 | $2,684 | $92,832 | $17,638 | $75,194 |
| 2016 | $2,530 | $87,497 | $16,624 | $70,873 |
| 2015 | $2,044 | $84,053 | $15,970 | $68,083 |
| 2014 | $2,044 | $78,203 | $14,859 | $63,344 |
Source: Public Records
Map
Nearby Homes
- 1424 Silverpines Rd Unit 1
- 1445 Bonanza Rd Unit 445
- 1517 Silverpines Rd
- 1525 Bonanza Rd Unit 525
- 1411 Ramada Dr Unit 1411
- 1516 Bay Area Blvd Unit 8
- 1516 Bay Area Blvd Unit L6
- 1516 Bay Area Blvd Unit P23
- 1516 Bay Area Blvd Unit 1
- 1516 Bay Area Blvd Unit R6
- 1500 Bay Area Blvd Unit B105
- 1500 Bay Area Blvd Unit 294
- 1500 Bay Area Blvd Unit 424
- 1500 Bay Area Blvd Unit 440
- 1500 Bay Area Blvd Unit 155
- 1500 Bay Area Blvd Unit 422
- 1500 Bay Area Blvd Unit 126
- 2003 Richvale Ln
- 1947 Richvale Ln
- 16502 Holly Trail Dr
- 1505 Bonanza Rd
- 1505 Bonanza Rd Unit 1505
- 1501 Bonanza Rd Unit 1
- 1509 Bonanza Rd Unit 1
- 1509 Bonanza Rd Unit 509
- 1509 Bonanza Rd Unit 1/509
- 1465 Bonanza Rd Unit 1
- 1461 Bonanza Rd Unit 1
- 1461 Bonanza Rd Unit 1461
- 1508 Silverpines Rd Unit 1
- 1508 Silverpines Rd Unit 1508
- 1457 Bonanza Rd Unit 1
- 1457 Bonanza Rd
- 1457 Bonanza Rd Unit 1/7457
- 1504 Silverpines Rd Unit 1
- 1513 Bonanza Rd Unit 1
- 1453 Bonanza Rd Unit 1
- 1453 Bonanza Rd Unit 1/453
- 1517 Bonanza Rd Unit 1
- 1512 Silverpines Rd Unit 1