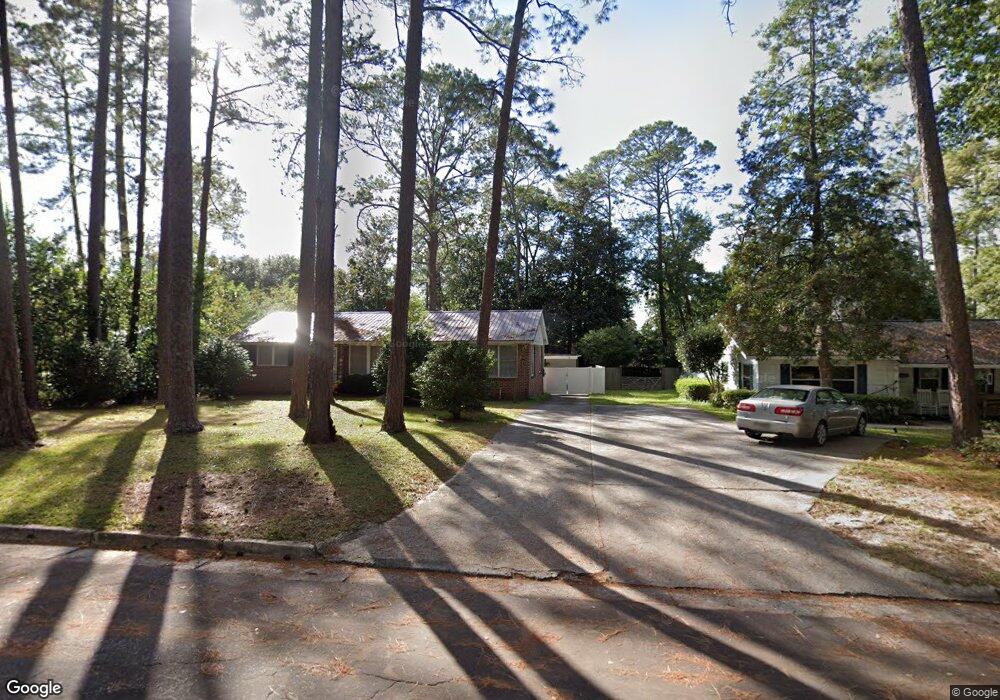
1505 Cherokee Dr Waycross, GA 31501
Estimated Value: $135,887 - $177,000
3
Beds
2
Baths
1,378
Sq Ft
$115/Sq Ft
Est. Value
About This Home
This home is located at 1505 Cherokee Dr, Waycross, GA 31501 and is currently estimated at $158,222, approximately $114 per square foot. 1505 Cherokee Dr is a home located in Ware County with nearby schools including Center Elementary School, Waycross Middle School, and Ware County High School.
Ownership History
Date
Name
Owned For
Owner Type
Purchase Details
Closed on
Dec 6, 2018
Sold by
Tanner Jerry L
Bought by
Croom Iesha Janae and Croom Donnothan Monte
Current Estimated Value
Home Financials for this Owner
Home Financials are based on the most recent Mortgage that was taken out on this home.
Original Mortgage
$97,272
Outstanding Balance
$85,371
Interest Rate
4.9%
Mortgage Type
New Conventional
Estimated Equity
$72,851
Purchase Details
Closed on
May 11, 2018
Sold by
Andrews Jeremy L
Bought by
Tanner Jerry L and Tanner Sharon L
Purchase Details
Closed on
Aug 2, 2012
Sold by
Council Ellen L
Bought by
Andrews Jeremy L
Home Financials for this Owner
Home Financials are based on the most recent Mortgage that was taken out on this home.
Original Mortgage
$74,489
Interest Rate
3.65%
Mortgage Type
New Conventional
Create a Home Valuation Report for This Property
The Home Valuation Report is an in-depth analysis detailing your home's value as well as a comparison with similar homes in the area
Purchase History
| Date | Buyer | Sale Price | Title Company |
|---|---|---|---|
| Croom Iesha Janae | $96,300 | -- | |
| Tanner Jerry L | $75,000 | -- | |
| Andrews Jeremy L | $65,000 | -- |
Source: Public Records
Mortgage History
| Date | Status | Borrower | Loan Amount |
|---|---|---|---|
| Open | Croom Iesha Janae | $97,272 | |
| Previous Owner | Andrews Jeremy L | $74,489 |
Source: Public Records
Tax History
| Year | Tax Paid | Tax Assessment Tax Assessment Total Assessment is a certain percentage of the fair market value that is determined by local assessors to be the total taxable value of land and additions on the property. | Land | Improvement |
|---|---|---|---|---|
| 2025 | $950 | $41,156 | $4,320 | $36,836 |
| 2024 | $950 | $41,156 | $4,320 | $36,836 |
| 2023 | $970 | $37,712 | $2,541 | $35,171 |
| 2022 | $1,101 | $37,712 | $2,541 | $35,171 |
| 2021 | $1,126 | $30,938 | $2,541 | $28,397 |
| 2020 | $1,135 | $29,558 | $2,541 | $27,017 |
| 2019 | $1,215 | $27,488 | $2,541 | $24,947 |
| 2018 | $1,188 | $26,626 | $2,541 | $24,085 |
| 2017 | $1,161 | $26,626 | $2,541 | $24,085 |
| 2016 | $1,161 | $26,626 | $2,541 | $24,085 |
| 2015 | $1,169 | $26,626 | $2,541 | $24,085 |
| 2014 | $1,168 | $26,626 | $2,541 | $24,085 |
| 2013 | -- | $29,779 | $2,541 | $27,238 |
Source: Public Records
Map
Nearby Homes
- 1501 Satilla Blvd
- 707 Euclid Ave
- 1701 Satilla Blvd
- 706 Cherokee Cir
- 1500 Saint Marys Dr
- 0 Saint Marys Dr Unit (TRACT 2 0.25 ACRES)
- 1602 Saint Marys Dr
- 804 Cherokee Cir
- 808 Euclid Ave
- 1003 Scruggs St
- 1004 Hill St
- 907 Euclid Ave
- 807 College St
- 101 Ricardo St
- 713 Magnolia Dr
- 1005 Seminole Trail
- 914 Baltimore Ave
- 1001 Baltimore Ave
- 808 Satilla Blvd
- .22 Alice St
- 1507 Cherokee Dr
- 1501 Cherokee Dr
- 1511 Cherokee Dr
- 405 Coral Rd
- 1504 Cherokee Dr
- 1500 Cherokee Dr
- 1508 Cherokee Dr
- 1404 Hill St
- 1515 Cherokee Dr
- 1600 Screven Ave
- 403 Coral Rd
- 1403 Cherokee Dr
- 1510 Cherokee Dr Unit 1
- 1510 Cherokee Dr
- 600 Seminole Trail
- 1405 Hill St
- 1512 Chrerokee Dr
- 1512 Cherokee Dr
- 501 Euclid Ave
- 1401 Cherokee Dr
Your Personal Tour Guide
Ask me questions while you tour the home.