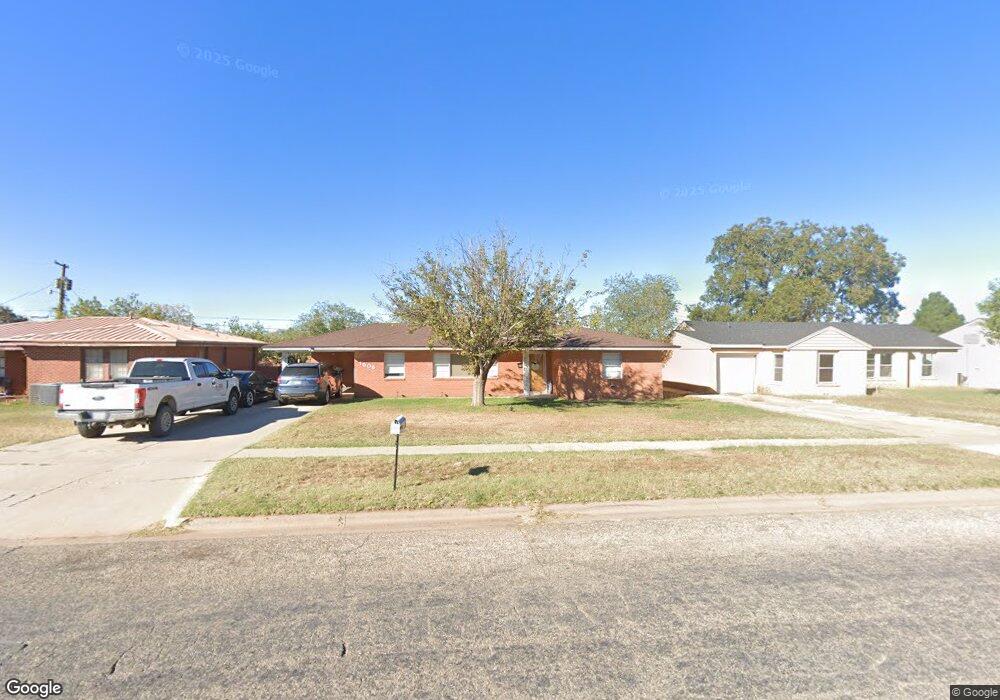
1505 E 11th Place Big Spring, TX 79720
Estimated Value: $171,000 - $216,000
3
Beds
2
Baths
2,027
Sq Ft
$94/Sq Ft
Est. Value
About This Home
This home is located at 1505 E 11th Place, Big Spring, TX 79720 and is currently estimated at $190,529, approximately $93 per square foot. 1505 E 11th Place is a home located in Howard County with nearby schools including Big Spring High School.
Ownership History
Date
Name
Owned For
Owner Type
Purchase Details
Closed on
Aug 30, 2023
Sold by
Bgrs Relocation Inc
Bought by
Salazar Guadalupe
Current Estimated Value
Home Financials for this Owner
Home Financials are based on the most recent Mortgage that was taken out on this home.
Original Mortgage
$183,612
Outstanding Balance
$180,063
Interest Rate
8.12%
Mortgage Type
FHA
Estimated Equity
$10,466
Purchase Details
Closed on
Jul 19, 2021
Sold by
Landin Juan Paul and Landin Kira Lynn
Bought by
Kearse Trinell
Home Financials for this Owner
Home Financials are based on the most recent Mortgage that was taken out on this home.
Original Mortgage
$142,373
Interest Rate
2.9%
Mortgage Type
FHA
Purchase Details
Closed on
Aug 29, 2013
Sold by
Avant James Roger and Avant James Roger
Bought by
Landin Ii Juan Paul and Landin Kira Lynn
Home Financials for this Owner
Home Financials are based on the most recent Mortgage that was taken out on this home.
Original Mortgage
$88,369
Interest Rate
4.75%
Mortgage Type
FHA
Create a Home Valuation Report for This Property
The Home Valuation Report is an in-depth analysis detailing your home's value as well as a comparison with similar homes in the area
Purchase History
| Date | Buyer | Sale Price | Title Company |
|---|---|---|---|
| Salazar Guadalupe | -- | None Listed On Document | |
| Kearse Trinell | -- | Surety Title Company | |
| Landin Ii Juan Paul | -- | Surety Title Company |
Source: Public Records
Mortgage History
| Date | Status | Borrower | Loan Amount |
|---|---|---|---|
| Open | Salazar Guadalupe | $183,612 | |
| Closed | Salazar Guadalupe | $9,181 | |
| Previous Owner | Kearse Trinell | $142,373 | |
| Previous Owner | Landin Ii Juan Paul | $88,369 |
Source: Public Records
Tax History
| Year | Tax Paid | Tax Assessment Tax Assessment Total Assessment is a certain percentage of the fair market value that is determined by local assessors to be the total taxable value of land and additions on the property. | Land | Improvement |
|---|---|---|---|---|
| 2025 | $1,707 | $176,981 | $5,526 | $171,455 |
| 2024 | $2,936 | $164,982 | $5,151 | $159,831 |
| 2023 | $3,130 | $177,545 | $6,300 | $171,245 |
| 2022 | $4,019 | $196,853 | $5,250 | $191,603 |
| 2021 | $2,832 | $149,527 | $5,250 | $144,277 |
| 2020 | $2,605 | $111,184 | $5,250 | $105,934 |
| 2019 | $2,519 | $99,592 | $5,250 | $94,342 |
| 2018 | $3,036 | $101,339 | $5,250 | $96,089 |
| 2017 | $3,034 | $103,086 | $5,250 | $97,836 |
| 2016 | $3,086 | $104,833 | $5,250 | $99,583 |
| 2015 | -- | $102,920 | $5,250 | $97,670 |
| 2014 | -- | $96,896 | $3,000 | $93,896 |
Source: Public Records
Map
Nearby Homes
- 1507 E 11th Place
- 204 Jefferson St
- 202 Jefferson St
- 1409 E 11th Place
- 1402 Wood St
- 1305 Lincoln Ave
- 1410 Tucson Rd
- 1301 Dixie Ave
- 100 Washington Blvd
- 1313 Stadium Ave
- 1710 Alabama St
- 1513 Vines Ave
- 2004 N Monticello St
- 1213 Ridgeroad Dr
- 803 Rosemont St
- 1302 Barnes Ave
- 1908 Morrison Dr
- 1706 Harvard Ave
- 1600 E 17th St
- 607 Mcewen St
- 1503 E 11th Place
- 1504 Wood St
- 1509 E 11th Place
- 1506 Wood St
- 1502 Wood St
- 1508 Wood St
- 1501 E 11th Place
- 1510 E 11th Place
- 1500 Wood St
- 1508 E 11th Place
- 1512 E 11th Place
- 1502 E 11th Place
- 1506 E 11th Place
- 1510 Wood St
- 1511 E 11th Place
- 1514 E 11th Place
- 1419 E 11th Place
- 1512 Wood St
- 1418 Wood St
- 1600 E 11th Place
Your Personal Tour Guide
Ask me questions while you tour the home.