Estimated Value: $263,704 - $326,000
1
Bed
2
Baths
1,482
Sq Ft
$197/Sq Ft
Est. Value
About This Home
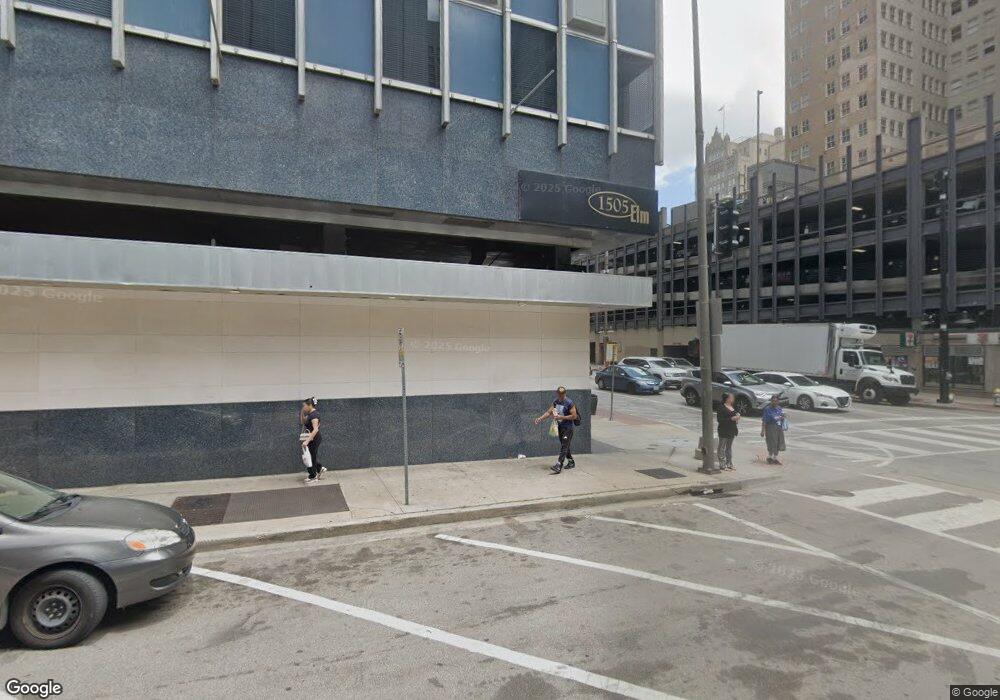
This home is located at 1505 Elm St Unit 602, Dallas, TX 75201 and is currently estimated at $291,426, approximately $196 per square foot. 1505 Elm St Unit 602 is a home located in Dallas County with nearby schools including Ben Milam Elementary School, Alex W. Spence Talented/Gifted Academy, and North Dallas High School.
Ownership History
Date
Name
Owned For
Owner Type
Purchase Details
Closed on
Feb 6, 2015
Sold by
Busby Melinda Z
Bought by
Denney Jesse A and Denney Roberta J
Current Estimated Value
Purchase Details
Closed on
Apr 15, 2008
Sold by
Alhadeff Mary Anne and Alhadeff David
Bought by
Busby Melinda Z
Home Financials for this Owner
Home Financials are based on the most recent Mortgage that was taken out on this home.
Original Mortgage
$218,500
Interest Rate
5.75%
Mortgage Type
Purchase Money Mortgage
Purchase Details
Closed on
Sep 27, 2005
Sold by
Astoria Downtown Dallas Lp
Bought by
Alhadeff Mary Anne
Home Financials for this Owner
Home Financials are based on the most recent Mortgage that was taken out on this home.
Original Mortgage
$22,000
Interest Rate
5.65%
Mortgage Type
Stand Alone Second
Create a Home Valuation Report for This Property
The Home Valuation Report is an in-depth analysis detailing your home's value as well as a comparison with similar homes in the area
Home Values in the Area
Average Home Value in this Area
Purchase History
| Date | Buyer | Sale Price | Title Company |
|---|---|---|---|
| Denney Jesse A | -- | Chicago Title | |
| Busby Melinda Z | -- | Atc | |
| Alhadeff Mary Anne | -- | -- |
Source: Public Records
Mortgage History
| Date | Status | Borrower | Loan Amount |
|---|---|---|---|
| Previous Owner | Busby Melinda Z | $218,500 | |
| Previous Owner | Alhadeff Mary Anne | $22,000 | |
| Previous Owner | Alhadeff Mary Anne | $176,000 |
Source: Public Records
Tax History Compared to Growth
Tax History
| Year | Tax Paid | Tax Assessment Tax Assessment Total Assessment is a certain percentage of the fair market value that is determined by local assessors to be the total taxable value of land and additions on the property. | Land | Improvement |
|---|---|---|---|---|
| 2025 | $1,738 | $288,990 | $12,560 | $276,430 |
| 2024 | $1,738 | $288,990 | $12,560 | $276,430 |
| 2023 | $1,738 | $259,370 | $11,240 | $248,130 |
| 2022 | $6,485 | $259,350 | $11,220 | $248,130 |
| 2021 | $6,842 | $259,350 | $11,220 | $248,130 |
| 2020 | $7,036 | $259,350 | $11,220 | $248,130 |
| 2019 | $7,379 | $259,350 | $11,220 | $248,130 |
| 2018 | $6,206 | $228,230 | $8,580 | $219,650 |
| 2017 | $6,206 | $228,230 | $8,580 | $219,650 |
| 2016 | $5,687 | $209,140 | $7,920 | $201,220 |
| 2015 | $3,877 | $209,140 | $7,920 | $201,220 |
| 2014 | $3,877 | $165,980 | $7,920 | $158,060 |
Source: Public Records
About This Building
Map
Nearby Homes
- 1505 Elm St Unit 1004
- 1505 Elm St Unit 501
- 1505 Elm St Unit 204
- 1505 Elm St Unit 1003
- 1505 Elm St Unit 303
- 1505 Elm St Unit 1401
- 1505 Elm St Unit 603
- 1505 Elm St Unit 1603
- 1200 Main St Unit 508
- 1200 Main St Unit 1510
- 1200 Main St Unit 1002
- 1200 Main St Unit 909
- 1200 Main St Unit 2408
- 1200 Main St Unit 1402
- 1200 Main St Unit 1404
- 1200 Main St Unit 1011
- 1200 Main St Unit 1201
- 1200 Main St Unit 2508
- 1200 Main St Unit 812
- 1200 Main St Unit 804
- 1505 Elm St Unit 1205
- 1505 Elm St Unit 903
- 1505 Elm St Unit 304
- 1505 Elm St Unit 1502
- 1505 Elm St Unit 203
- 1505 Elm St Unit 804
- 1505 Elm St Unit 205
- 1505 Elm St Unit 604
- 1505 Elm St Unit 402
- 1505 Elm St Unit 503
- 1505 Elm St Unit 404
- 1505 Elm St Unit 901
- 1505 Elm St Unit 1105
- 1505 Elm St Unit 502
- 1505 Elm St Unit 202
- 1505 Elm St Unit 1102
- 1505 Elm St Unit 1501
- 1505 Elm St Unit 1203
- 1505 Elm St Unit 702
- 1505 Elm St Unit 802