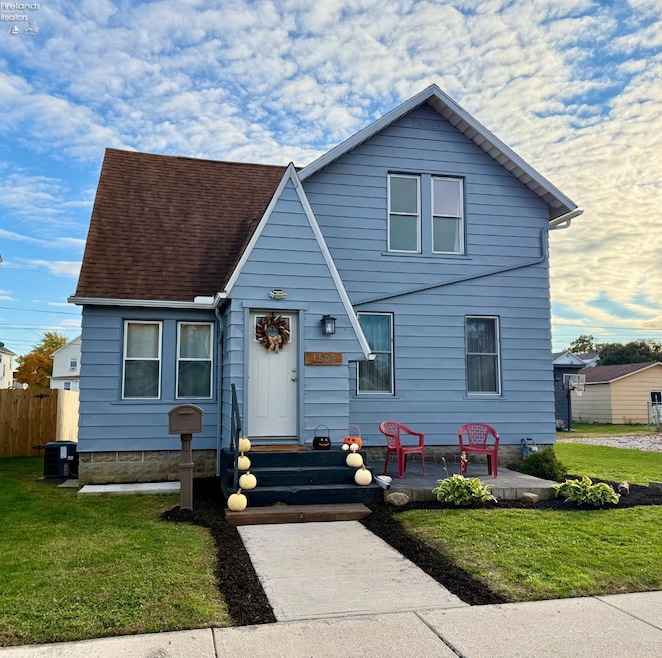
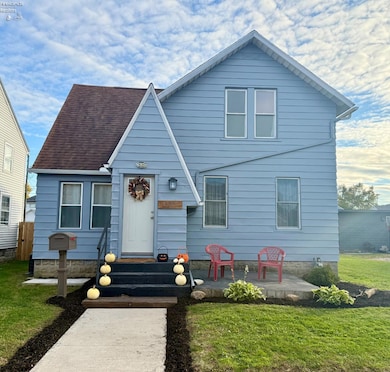
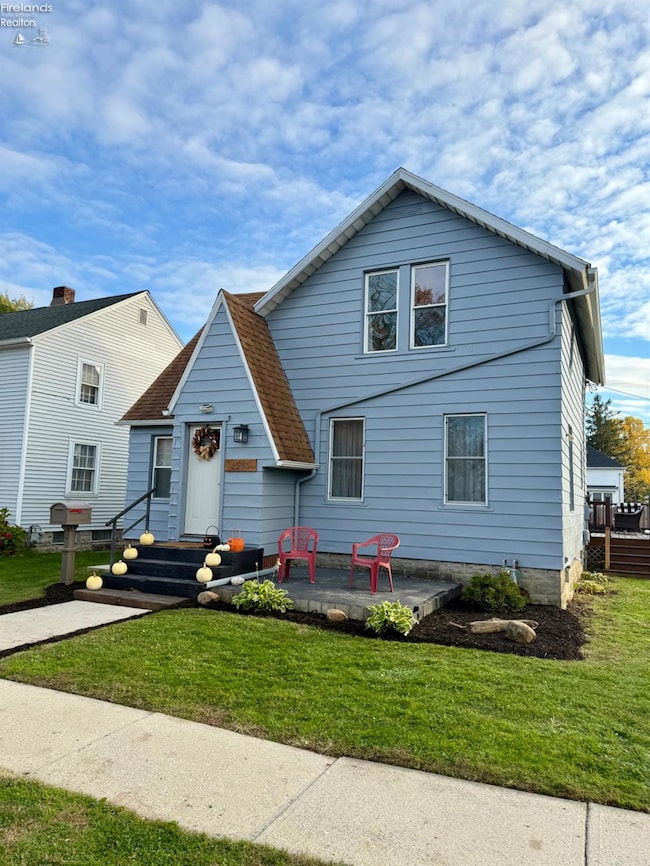
1505 Fenwick St Fremont, OH 43420
Estimated payment $941/month
Highlights
- Popular Property
- Formal Dining Room
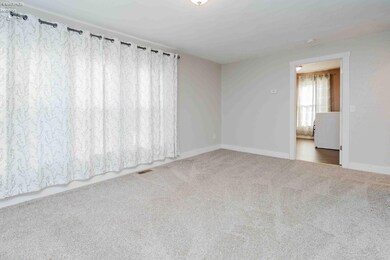
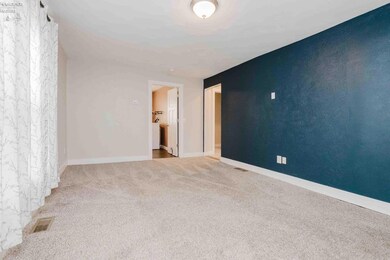
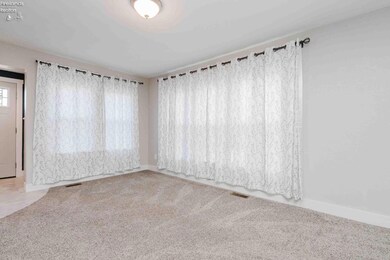
- Living Room
- Main Floor Primary Bedroom
- 2 Car Detached Garage
- Entrance Foyer
About This Home
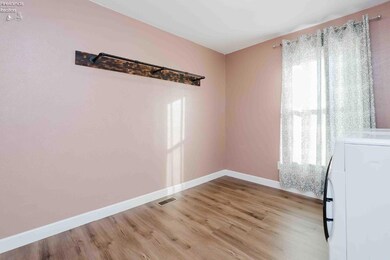
Welcome to 1505 Fenwick St. Fremont .. Step into this fully renovated, move in ready home featuring four spacious bedrooms and two full bathrooms. Every detail has been thoughtfully updated from the stups up, blending modern upgrades with comfort and style. Enjoy peace of mind with new plumbing, electrical, furnace, central air, hot water and windows. The interior and exterior have been freshly painted and luxury finishes abound, including luxury vinyl flooring in the kitchen, dining room and both bathrooms, plus new carpet in the living room and bedrooms. The gorgeous kitchen is a chef's dream, showcasing granite countertops, new cabinetry, tile backsplash, deep basin kitchen and modern lighting. Spacious living room area offers comfort and functionality, while the LED lighting throughout, hardwired smoke detectors and new deck with trex handrails and solar lights add both safety and charm. Situated on two parcels, this property provides ample outdoor space for relaxing, entertaining or future expansion. Every inch of this home has been redone making it truly a turn-key ready for you to move in home.
Co-Listing Agent
Default zSystem
zSystem Default
Home Details
Home Type
- Single Family
Est. Annual Taxes
- $547
Year Built
- Built in 1900
Lot Details
- 5,097 Sq Ft Lot
- Additional Parcels
Parking
- 2 Car Detached Garage
- Alley Access
- Off-Street Parking
Home Design
- Asphalt Roof
- Aluminum Siding
Interior Spaces
- 1,333 Sq Ft Home
- 1.5-Story Property
- Ceiling Fan
- Entrance Foyer
- Living Room
- Formal Dining Room
- Partial Basement
Kitchen
- Range
- Microwave
- Dishwasher
- Disposal
Bedrooms and Bathrooms
- 4 Bedrooms
- Primary Bedroom on Main
- 2 Full Bathrooms
Utilities
- Forced Air Heating and Cooling System
- Heating System Uses Natural Gas
- 200+ Amp Service
Listing and Financial Details
- Assessor Parcel Number 345000429400
Map
Home Values in the Area
Average Home Value in this Area
Tax History
| Year | Tax Paid | Tax Assessment Tax Assessment Total Assessment is a certain percentage of the fair market value that is determined by local assessors to be the total taxable value of land and additions on the property. | Land | Improvement |
|---|---|---|---|---|
| 2024 | $555 | $42,250 | $5,990 | $36,260 |
| 2023 | $555 | $33,530 | $4,760 | $28,770 |
| 2022 | $535 | $33,530 | $4,760 | $28,770 |
| 2021 | $565 | $33,530 | $4,760 | $28,770 |
| 2020 | $586 | $14,110 | $4,760 | $9,350 |
| 2019 | $585 | $14,110 | $4,760 | $9,350 |
| 2018 | $723 | $17,400 | $4,760 | $12,640 |
| 2017 | $684 | $16,800 | $4,760 | $12,040 |
| 2016 | $600 | $16,800 | $4,760 | $12,040 |
| 2015 | $589 | $16,800 | $4,760 | $12,040 |
| 2014 | $619 | $16,810 | $4,800 | $12,010 |
| 2013 | $620 | $16,810 | $4,800 | $12,010 |
Property History
| Date | Event | Price | List to Sale | Price per Sq Ft |
|---|---|---|---|---|
| 11/13/2025 11/13/25 | For Sale | $169,900 | -- | $127 / Sq Ft |
Purchase History
| Date | Type | Sale Price | Title Company |
|---|---|---|---|
| Warranty Deed | $110,000 | E Title Services | |
| Warranty Deed | $10,000 | None Available | |
| Warranty Deed | $9,500 | Attorney | |
| Deed | $35,000 | -- | |
| Deed | -- | -- |
Mortgage History
| Date | Status | Loan Amount | Loan Type |
|---|---|---|---|
| Open | $104,500 | Purchase Money Mortgage |
Source: Firelands Association of REALTORS®
MLS Number: 20254379
APN: 34-50-00-4294-00
- 1520 Fenwick St
- 125 Austin St Unit 125
- 115 N Taft Ave
- 1342 Mcpherson Blvd
- 1611 Mcpherson Blvd
- 927 Wolfe Ave
- 2531 Cr 65
- 2119 Lake St
- 905 Baker St Unit 907
- 920 Garrison St
- 2242 Napoleon Rd
- 1111 Arlington St
- 515 Everett Rd
- 1019 Rawson Place
- 930 Clinton St
- 614 3rd Ave
- 520 Everett Rd
- 427 N Clover St
- 711 Rawson Ave
- 1028 June St
- 1528 North St
- 711 South St
- 166 Thomas Dr Unit A
- 218 State St
- 735 S Main St
- 307 Maple St Unit 307 Maple
- 1016 Ottawa Dr
- 356 Clinton Reef Dr Unit 356
- 352 Clinton Reef Dr
- 272 Clinton Reef Dr Unit 272
- 653 N Sandusky St
- 415 Short St Unit ID1061032P
- 214 Fulton St Unit B
- 100 Steeplechase Ave
- 171 N Buckeye St
- 171 N Buckeye St
- 71 Jackson St
- 186-2 S Washington St
- 186-2 S Washington St
- 975 Monroe St
