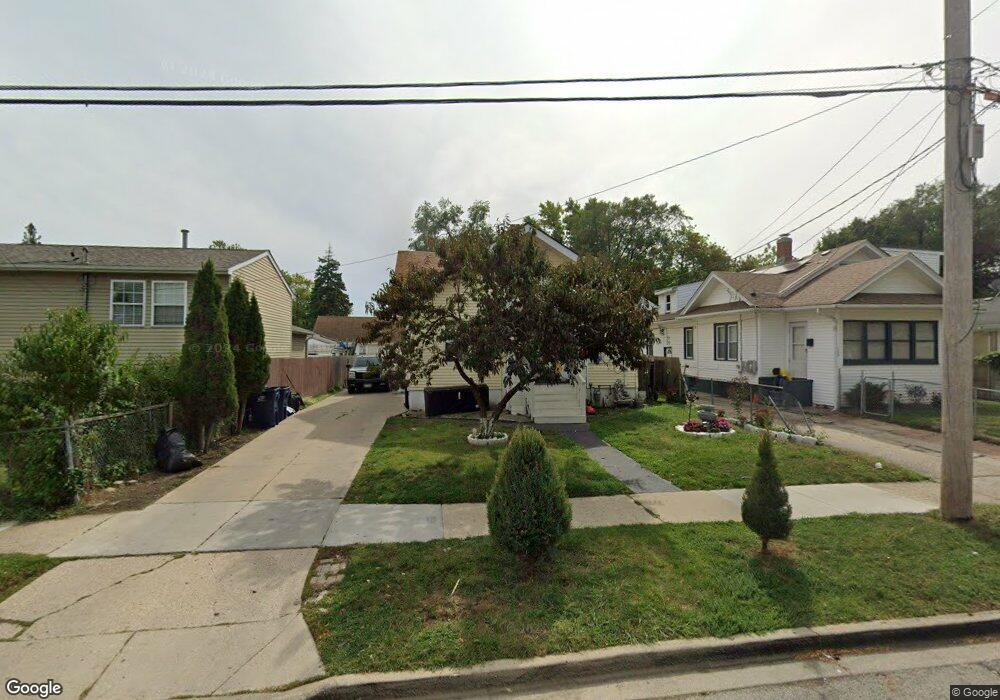
1505 Garden Place Waukegan, IL 60085
Waukegan Gardens NeighborhoodEstimated Value: $190,000 - $216,000
3
Beds
1
Bath
1,118
Sq Ft
$183/Sq Ft
Est. Value
About This Home
This home is located at 1505 Garden Place, Waukegan, IL 60085 and is currently estimated at $204,230, approximately $182 per square foot. 1505 Garden Place is a home located in Lake County with nearby schools including Whittier Elementary School, Edith M Smith Middle School, and Waukegan High School.
Ownership History
Date
Name
Owned For
Owner Type
Purchase Details
Closed on
Jan 28, 2002
Sold by
Panchi Maria and Gomez Benito
Bought by
Gomez Benito
Current Estimated Value
Home Financials for this Owner
Home Financials are based on the most recent Mortgage that was taken out on this home.
Original Mortgage
$70,000
Interest Rate
7.23%
Purchase Details
Closed on
Jan 3, 2002
Sold by
Panchi Maria
Bought by
Panchi Maria and Gomez Benito
Home Financials for this Owner
Home Financials are based on the most recent Mortgage that was taken out on this home.
Original Mortgage
$70,000
Interest Rate
7.23%
Purchase Details
Closed on
Jun 19, 1996
Sold by
Bank Of Northern Illinois Na
Bought by
Panchi Maria
Home Financials for this Owner
Home Financials are based on the most recent Mortgage that was taken out on this home.
Original Mortgage
$66,871
Interest Rate
8.33%
Mortgage Type
FHA
Create a Home Valuation Report for This Property
The Home Valuation Report is an in-depth analysis detailing your home's value as well as a comparison with similar homes in the area
Home Values in the Area
Average Home Value in this Area
Purchase History
| Date | Buyer | Sale Price | Title Company |
|---|---|---|---|
| Gomez Benito | -- | -- | |
| Panchi Maria | -- | -- | |
| Panchi Maria | $67,000 | -- |
Source: Public Records
Mortgage History
| Date | Status | Borrower | Loan Amount |
|---|---|---|---|
| Closed | Gomez Benito | $70,000 | |
| Closed | Panchi Maria | $66,871 |
Source: Public Records
Tax History Compared to Growth
Tax History
| Year | Tax Paid | Tax Assessment Tax Assessment Total Assessment is a certain percentage of the fair market value that is determined by local assessors to be the total taxable value of land and additions on the property. | Land | Improvement |
|---|---|---|---|---|
| 2024 | $4,002 | $46,936 | $7,816 | $39,120 |
| 2023 | $3,769 | $42,436 | $7,066 | $35,370 |
| 2022 | $3,769 | $38,550 | $5,399 | $33,151 |
| 2021 | $3,305 | $31,700 | $4,722 | $26,978 |
| 2020 | $3,348 | $29,532 | $4,399 | $25,133 |
| 2019 | $3,369 | $27,061 | $4,031 | $23,030 |
| 2018 | $3,046 | $23,558 | $5,071 | $18,487 |
| 2017 | $2,965 | $20,842 | $4,486 | $16,356 |
| 2016 | $2,799 | $18,111 | $3,898 | $14,213 |
| 2015 | $2,738 | $16,210 | $3,489 | $12,721 |
| 2014 | $3,397 | $20,077 | $3,450 | $16,627 |
| 2012 | $4,210 | $21,752 | $3,738 | $18,014 |
Source: Public Records
Map
Nearby Homes
- 824 N Butrick St
- 1000 Pine St
- 1109 Massena Ave
- 917 N Linden Ave
- 1117 Judge Ave
- 1023 N Elmwood Ave
- 1005 N Lewis Ave
- 1038 Indiana Ave
- 1213 Grand Ave
- 1105 Woodlawn Cir
- 1504 W Glen Flora Ave
- 1312 N Linden Ave
- 620 N Poplar St
- 702 Franklin St
- 522 N Poplar St
- 511 Chestnut St
- 918 N Ash St
- 615 Tiffany Dr
- 12787 W Grove Ave
- 428 N Poplar St
- 822 Yeoman St
- 1509 Garden Place
- 816 Yeoman St
- 1513 Garden Place
- 814 Yeoman St
- 1517 Garden Place
- 1419 Garden Place
- 810 Yeoman St
- 817 New York St
- 1506 Garden Place
- 1510 Garden Place
- 1521 Garden Place
- 1502 Garden Place
- 1417 Garden Place
- 1514 Garden Place
- 806 Yeoman St
- 809 New York St
- 817 Yeoman St
- 1516 Garden Place
- 1420 Garden Place