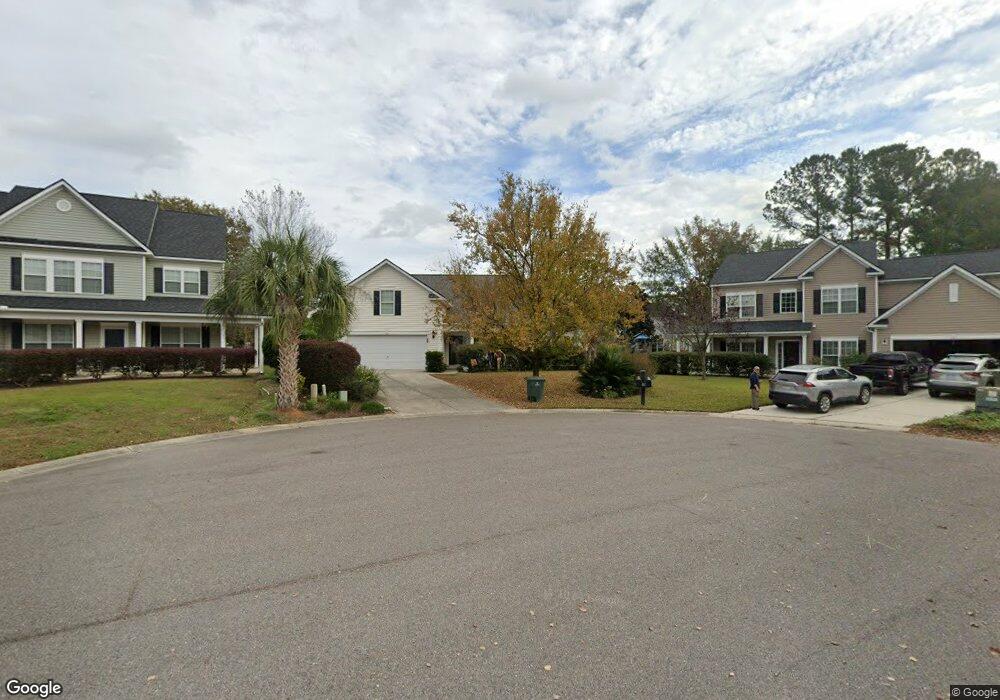
1505 Marsh Reed Ct Hanahan, SC 29410
Estimated Value: $483,787 - $554,000
4
Beds
2
Baths
2,223
Sq Ft
$234/Sq Ft
Est. Value
About This Home
This home is located at 1505 Marsh Reed Ct, Hanahan, SC 29410 and is currently estimated at $519,697, approximately $233 per square foot. 1505 Marsh Reed Ct is a home located in Berkeley County with nearby schools including Bowen's Corner Elementary, Hanahan Middle School, and Hanahan High School.
Ownership History
Date
Name
Owned For
Owner Type
Purchase Details
Closed on
Jul 18, 2012
Sold by
Cook Kenneth and Cook Lola
Bought by
Dwyer John E and Dwyer Barbara A
Current Estimated Value
Home Financials for this Owner
Home Financials are based on the most recent Mortgage that was taken out on this home.
Original Mortgage
$172,000
Outstanding Balance
$119,010
Interest Rate
3.72%
Mortgage Type
Future Advance Clause Open End Mortgage
Estimated Equity
$400,687
Purchase Details
Closed on
Feb 14, 2012
Sold by
Rowland Barbara Ann and Rowland Douglas E
Bought by
Cook Lola and Cook Kenneth
Purchase Details
Closed on
Oct 26, 2006
Sold by
The Ryland Group Inc
Bought by
Rowland Barbara Ann and Rowland Douglas E
Home Financials for this Owner
Home Financials are based on the most recent Mortgage that was taken out on this home.
Original Mortgage
$100,000
Interest Rate
6.39%
Mortgage Type
Future Advance Clause Open End Mortgage
Create a Home Valuation Report for This Property
The Home Valuation Report is an in-depth analysis detailing your home's value as well as a comparison with similar homes in the area
Home Values in the Area
Average Home Value in this Area
Purchase History
| Date | Buyer | Sale Price | Title Company |
|---|---|---|---|
| Dwyer John E | $215,000 | -- | |
| Cook Lola | $211,000 | -- | |
| Rowland Barbara Ann | $280,707 | None Available |
Source: Public Records
Mortgage History
| Date | Status | Borrower | Loan Amount |
|---|---|---|---|
| Open | Dwyer John E | $172,000 | |
| Previous Owner | Rowland Barbara Ann | $100,000 |
Source: Public Records
Tax History Compared to Growth
Tax History
| Year | Tax Paid | Tax Assessment Tax Assessment Total Assessment is a certain percentage of the fair market value that is determined by local assessors to be the total taxable value of land and additions on the property. | Land | Improvement |
|---|---|---|---|---|
| 2025 | $1,282 | $274,287 | $60,098 | $214,189 |
| 2024 | $1,282 | $10,972 | $2,404 | $8,568 |
| 2023 | $1,282 | $10,972 | $2,404 | $8,568 |
| 2022 | $1,212 | $9,540 | $1,818 | $7,722 |
| 2021 | $1,142 | $9,540 | $1,818 | $7,722 |
| 2020 | $1,077 | $9,540 | $1,818 | $7,722 |
| 2019 | $1,116 | $9,540 | $1,818 | $7,722 |
| 2018 | $994 | $8,296 | $2,000 | $6,296 |
| 2017 | $974 | $8,296 | $2,000 | $6,296 |
| 2016 | $1,270 | $8,300 | $2,000 | $6,300 |
| 2015 | $1,115 | $8,300 | $2,000 | $6,300 |
| 2014 | $1,093 | $8,300 | $2,000 | $6,300 |
| 2013 | -- | $8,300 | $2,000 | $6,300 |
Source: Public Records
Map
Nearby Homes
- 7532 Hawks Cir
- 1038 Old Cypress Run
- 7502 Scupper Dr
- 133 Hanahan Plantation Cir
- 115 Milton Dr
- 7406 Mercedes Way
- 7402 Purser Ln
- 1333 Song Sparrow Way
- 202 Waterwood Dr Unit 2302
- 7434 Northgate Dr
- 201 Greenmeadow Dr
- 202 Greenmeadow Dr
- 605 Waterwood Dr Unit 1505
- 607 Waterwood Dr
- 1005 Waterwood Dr
- 902 Greenmeadow Dr Unit 1702
- 1001 Waterwood Dr Unit 1301
- 7326 Kestrel Trail
- 806 Greenmeadow Dr Unit 406
- 103 Greencastle Dr
- 1503 Marsh Reed Ct
- 1507 Marsh Reed Ct
- 1503 Saint Stephens Way
- 1503 St Stephens Way
- 1505 Saint Stephens Way
- 1501 St Stephens Way
- 1501 Saint Stephens Way
- 1501 Marsh Reed Ct
- 7525 Hawks Cir
- 1507 Saint Stephens Way
- 1506 Marsh Reed Ct
- 1504 Marsh Reed Ct
- 1502 Marsh Reed Ct
- 7523 Hawks Cir
- 7553 Hawks Cir
- 1509 Saint Stephens Way
- 1500 Marsh Reed Ct
- 7551 Hawks Cir
- 7530 Hawks Cir
- 7534 Hawks Cir