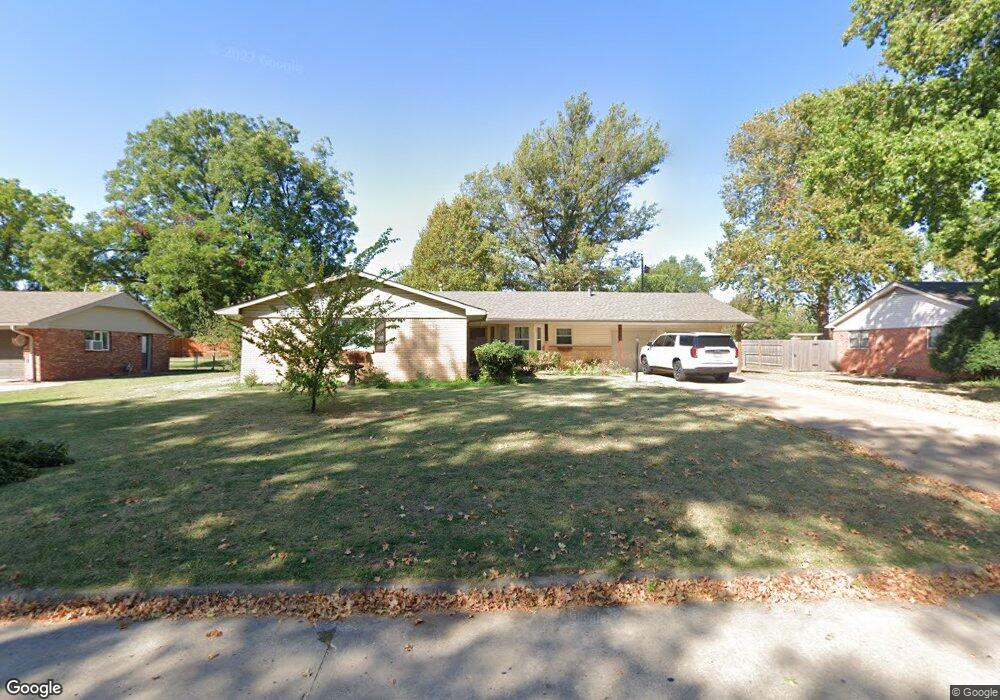
1505 Melmart Dr Bartlesville, OK 74006
Estimated Value: $197,000 - $233,000
3
Beds
2
Baths
1,785
Sq Ft
$123/Sq Ft
Est. Value
About This Home
This home is located at 1505 Melmart Dr, Bartlesville, OK 74006 and is currently estimated at $218,671, approximately $122 per square foot. 1505 Melmart Dr is a home located in Washington County with nearby schools including Ranch Heights Elementary School, Madison Middle School, and Bartlesville High School.
Ownership History
Date
Name
Owned For
Owner Type
Purchase Details
Closed on
Aug 16, 2022
Sold by
Bylsma Jr John C and Bylsma Susan K
Bought by
Day Robby Joe and Day Lisa Michelle
Current Estimated Value
Home Financials for this Owner
Home Financials are based on the most recent Mortgage that was taken out on this home.
Original Mortgage
$171,000
Outstanding Balance
$162,979
Interest Rate
5.3%
Mortgage Type
New Conventional
Estimated Equity
$55,692
Purchase Details
Closed on
Aug 27, 2018
Sold by
Spradling Frances Maureen and The Spradling Family Trust
Bought by
Bylsma John C and Bylsma Susan K
Home Financials for this Owner
Home Financials are based on the most recent Mortgage that was taken out on this home.
Original Mortgage
$60,000
Interest Rate
4.5%
Mortgage Type
Seller Take Back
Purchase Details
Closed on
Jun 16, 2017
Sold by
Brink Cynthia and Mcguire Cynthia
Bought by
Spradling Frances Maureen and The Spradling
Purchase Details
Closed on
Jul 1, 2003
Sold by
Brink Anna C
Bought by
Brink Anna Trust & As Trustee
Create a Home Valuation Report for This Property
The Home Valuation Report is an in-depth analysis detailing your home's value as well as a comparison with similar homes in the area
Home Values in the Area
Average Home Value in this Area
Purchase History
| Date | Buyer | Sale Price | Title Company |
|---|---|---|---|
| Day Robby Joe | $180,000 | Apex Title & Closing Service | |
| Bylsma John C | $110,000 | Mckesson Title | |
| Spradling Frances Maureen | $85,000 | None Available | |
| Brink Anna Trust & As Trustee | -- | -- |
Source: Public Records
Mortgage History
| Date | Status | Borrower | Loan Amount |
|---|---|---|---|
| Open | Day Robby Joe | $171,000 | |
| Previous Owner | Bylsma John C | $60,000 |
Source: Public Records
Tax History Compared to Growth
Tax History
| Year | Tax Paid | Tax Assessment Tax Assessment Total Assessment is a certain percentage of the fair market value that is determined by local assessors to be the total taxable value of land and additions on the property. | Land | Improvement |
|---|---|---|---|---|
| 2025 | $2,672 | $21,854 | $1,440 | $20,414 |
| 2024 | $2,672 | $22,249 | $1,440 | $20,809 |
| 2023 | $2,672 | $21,190 | $1,440 | $19,750 |
| 2022 | $1,567 | $14,083 | $1,440 | $12,643 |
| 2021 | $1,503 | $13,797 | $1,440 | $12,357 |
| 2020 | $1,488 | $13,396 | $1,440 | $11,956 |
| 2019 | $1,442 | $13,006 | $1,440 | $11,566 |
| 2018 | $1,281 | $10,717 | $1,440 | $9,277 |
| 2017 | $970 | $7,926 | $1,440 | $6,486 |
| 2016 | $867 | $7,549 | $1,440 | $6,109 |
| 2015 | $838 | $7,189 | $1,489 | $5,700 |
| 2014 | $719 | $7,189 | $1,489 | $5,700 |
Source: Public Records
Map
Nearby Homes
- 1435 Lariat Dr
- 1412 Meadow Ln
- 1521 Lariat Dr
- 1500 Harris Dr
- 1354 Harris Dr
- 1232 Meadow Dr
- 4040 Sheridan Rd
- 1222 Lariat Dr
- 1250 Macklyn Ln
- 1054 Meadow Dr
- 1801 Rolling Hills Place
- 4626 Rolling Meadows Rd
- 4607 Rolling Hills Dr
- 1425 S Madison Blvd
- 1115 Grandview Rd
- 1242 May Ln
- 5269 Nowata Rd Unit O102
- 4910 Rolling Meadows Rd
- 5217 Nowata Rd Unit 203C
- 5217 Nowata Rd Unit C204
- 1505 Melmart Dr
- 1503 Melmart Dr
- 1513 Melmart Dr
- 1500 Melmart Dr
- 1501 Melmart Dr
- 1508 Melmart Dr
- 4507 Bridle Rd
- 1512 Melmart Dr
- 4501 Bridle Rd
- 1517 Melmart Dr
- 1505 Lariat Dr
- 1501 Lariat Dr
- 1509 Lariat Dr
- 1516 Melmart Dr
- 1422 Melmart Dr
- 1419 Melmart Dr
- 4417 Bridle Rd
- 1513 Lariat Dr
- 1418 Meadow Ln
- 1517 Lariat Dr