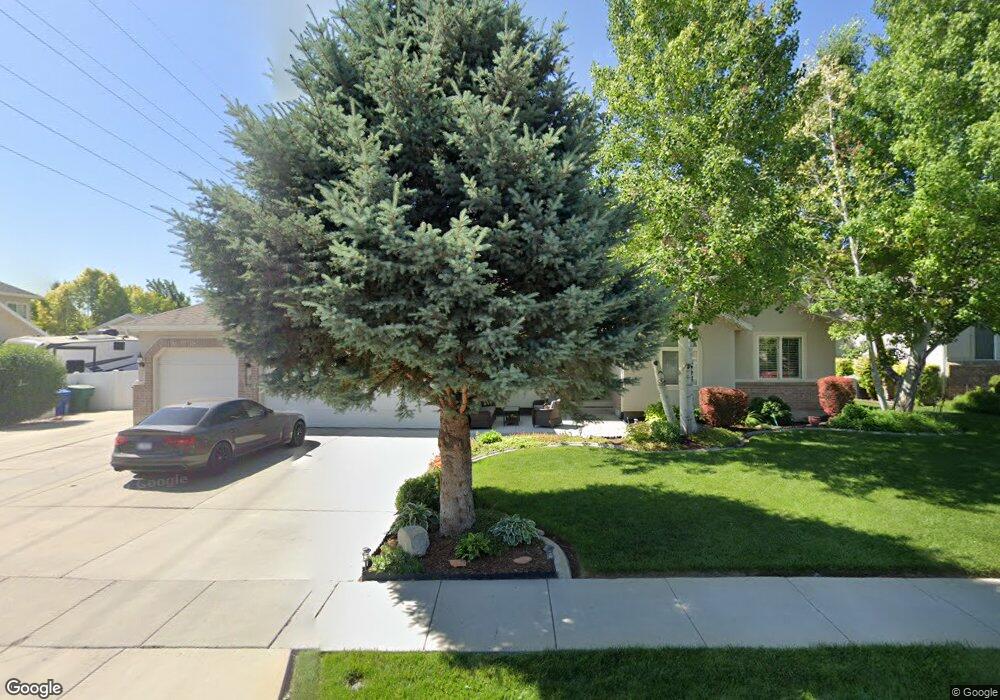
1505 Misty Fen Way West Jordan, UT 84088
Estimated Value: $745,000 - $873,000
5
Beds
4
Baths
3,702
Sq Ft
$221/Sq Ft
Est. Value
About This Home
This home is located at 1505 Misty Fen Way, West Jordan, UT 84088 and is currently estimated at $816,347, approximately $220 per square foot. 1505 Misty Fen Way is a home located in Salt Lake County with nearby schools including Riverside Elementary School, West Jordan Middle School, and West Jordan High School.
Ownership History
Date
Name
Owned For
Owner Type
Purchase Details
Closed on
Sep 23, 2019
Sold by
Cabral Fatima
Bought by
Cabral Fatima and Cabral Carlos Alberto
Current Estimated Value
Home Financials for this Owner
Home Financials are based on the most recent Mortgage that was taken out on this home.
Original Mortgage
$211,500
Outstanding Balance
$185,258
Interest Rate
3.6%
Mortgage Type
New Conventional
Estimated Equity
$631,089
Purchase Details
Closed on
Dec 5, 2018
Sold by
Sagario Cabral Fatima Del
Bought by
Sagrario Cabral Fatima Del and Cabral Carlos Alberto
Home Financials for this Owner
Home Financials are based on the most recent Mortgage that was taken out on this home.
Original Mortgage
$205,000
Interest Rate
4.8%
Mortgage Type
New Conventional
Purchase Details
Closed on
Dec 4, 2018
Sold by
Freeman Jackie L
Bought by
Sagrario Cabral Fatima Del
Home Financials for this Owner
Home Financials are based on the most recent Mortgage that was taken out on this home.
Original Mortgage
$205,000
Interest Rate
4.8%
Mortgage Type
New Conventional
Purchase Details
Closed on
Feb 14, 2013
Sold by
Esplin John and Quan Esplin Jan
Bought by
Freeman Jackie L
Home Financials for this Owner
Home Financials are based on the most recent Mortgage that was taken out on this home.
Original Mortgage
$351,400
Interest Rate
3.29%
Mortgage Type
New Conventional
Purchase Details
Closed on
Jan 12, 2012
Sold by
Esplin John D and Esplin Jan
Bought by
Esplin John and Quan Esplin Jan
Purchase Details
Closed on
Dec 19, 2011
Sold by
Esplin John and Quan Esplin Jan
Bought by
Esplin John and Quan Esplin Jan
Purchase Details
Closed on
Mar 29, 2004
Sold by
Misak Kendall A
Bought by
Esplin John D and Esplin Jan
Home Financials for this Owner
Home Financials are based on the most recent Mortgage that was taken out on this home.
Original Mortgage
$218,000
Interest Rate
5.57%
Mortgage Type
Purchase Money Mortgage
Purchase Details
Closed on
Feb 20, 1998
Sold by
Sly Steven C
Bought by
Misak Kendall A
Home Financials for this Owner
Home Financials are based on the most recent Mortgage that was taken out on this home.
Original Mortgage
$185,400
Interest Rate
6.97%
Purchase Details
Closed on
Jan 24, 1997
Sold by
Lindstrom Larry B
Bought by
Sly Steven C
Home Financials for this Owner
Home Financials are based on the most recent Mortgage that was taken out on this home.
Original Mortgage
$160,500
Interest Rate
7.74%
Purchase Details
Closed on
May 15, 1996
Sold by
Hafeman William C and Christensen Don M
Bought by
Lindstrom Larry B
Create a Home Valuation Report for This Property
The Home Valuation Report is an in-depth analysis detailing your home's value as well as a comparison with similar homes in the area
Home Values in the Area
Average Home Value in this Area
Purchase History
| Date | Buyer | Sale Price | Title Company |
|---|---|---|---|
| Cabral Fatima | -- | Vanguard Title Union Park | |
| Cabral Fatima | -- | Vanguard Title Union Park | |
| Sagrario Cabral Fatima Del | -- | Gt Title Services Slc | |
| Sagrario Cabral Fatima Del | -- | Vanguard Title | |
| Freeman Jackie L | -- | First American Title | |
| Esplin John | -- | None Available | |
| Esplin John | -- | None Available | |
| Esplin John D | -- | Pinnacle Title Co | |
| Misak Kendall A | -- | -- | |
| Sly Steven C | -- | -- | |
| Lindstrom Larry B | -- | -- |
Source: Public Records
Mortgage History
| Date | Status | Borrower | Loan Amount |
|---|---|---|---|
| Open | Cabral Fatima | $211,500 | |
| Closed | Sagrario Cabral Fatima Del | $205,000 | |
| Previous Owner | Freeman Jackie L | $351,400 | |
| Previous Owner | Esplin John D | $218,000 | |
| Previous Owner | Misak Kendall A | $185,400 | |
| Previous Owner | Sly Steven C | $160,500 | |
| Closed | Esplin John D | $27,250 |
Source: Public Records
Tax History Compared to Growth
Tax History
| Year | Tax Paid | Tax Assessment Tax Assessment Total Assessment is a certain percentage of the fair market value that is determined by local assessors to be the total taxable value of land and additions on the property. | Land | Improvement |
|---|---|---|---|---|
| 2025 | $4,067 | $768,800 | $145,000 | $623,800 |
| 2024 | $4,067 | $782,500 | $143,500 | $639,000 |
| 2023 | $3,946 | $715,500 | $129,300 | $586,200 |
| 2022 | $4,056 | $723,600 | $126,700 | $596,900 |
| 2021 | $3,272 | $531,400 | $95,000 | $436,400 |
| 2020 | $3,204 | $488,300 | $95,000 | $393,300 |
| 2019 | $3,186 | $476,100 | $95,000 | $381,100 |
| 2018 | $3,011 | $446,300 | $93,800 | $352,500 |
| 2017 | $2,904 | $428,600 | $93,800 | $334,800 |
| 2016 | $2,848 | $394,900 | $93,800 | $301,100 |
| 2015 | $2,872 | $388,200 | $95,600 | $292,600 |
| 2014 | $2,752 | $366,300 | $91,100 | $275,200 |
Source: Public Records
Map
Nearby Homes
- 1673 Peaceful Cir
- 8686 S Temple Dr
- 9511 S Tirado Cove Unit 204
- Brook Haven Plan at Jordan Woods
- Maple Plan at Jordan Woods
- The Maple Basement Plan at Jordan Woods
- The Evergreen Basement Plan at Jordan Woods
- 9503 S Tirado Cove Unit 203
- 1719 W Brocious Way Unit 301
- 1753 Rylie Ann Cir
- 9635 S 1600 W
- 9141 S Little Creek Dr
- 1741 W Nikos Ln
- 1718 W Thira Ln
- 9496 S 1930 W
- 1968 W 9270 S Unit C
- 1767 W Ikaros Ln
- 1788 W Ikaros Ln
- 9414 S 1980 W
- 9297 S Avignon Place
- 1505 W Misty Fen Way
- 1521 Misty Fen Way
- 1521 W Misty Fen Way Unit 50
- 1485 Misty Fen Way
- 9429 Dunbar Cove
- 9423 Dunbar Cove
- 1456 W 9380 S Unit 37
- 1533 Misty Fen Way
- 1506 Misty Fen Way
- 1471 W Misty Fen Way
- 9422 Morywood Cir
- 1471 Misty Fen Way
- 9422 S Morywood Cir
- 1522 Misty Fen Way
- 1486 Misty Fen Way
- 1459 W Misty Fen Way
- 1534 Misty Fen Way
- 1534 W Misty Fen Way
- 9428 Dunbar Cove
- 9433 Dunbar Cove