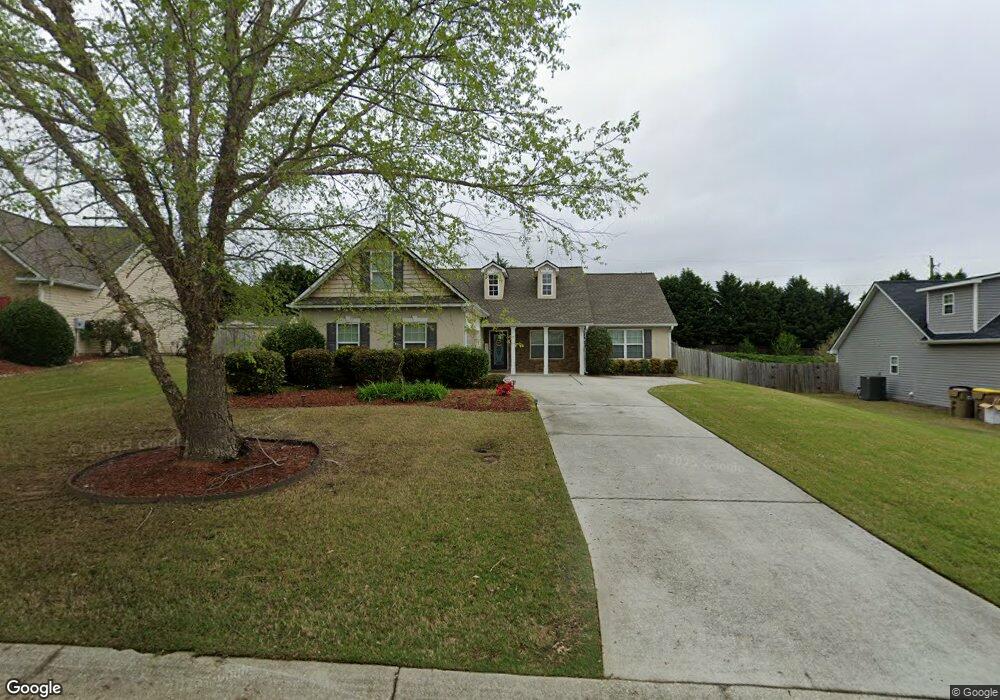
1505 Pointe South Cir Bethlehem, GA 30620
Estimated Value: $353,000 - $377,012
--
Bed
2
Baths
1,915
Sq Ft
$190/Sq Ft
Est. Value
About This Home
This home is located at 1505 Pointe South Cir, Bethlehem, GA 30620 and is currently estimated at $364,253, approximately $190 per square foot. 1505 Pointe South Cir is a home located in Barrow County with nearby schools including Yargo Elementary School, Haymon-Morris Middle School, and Apalachee High School.
Ownership History
Date
Name
Owned For
Owner Type
Purchase Details
Closed on
Oct 18, 2023
Sold by
Casco Roger
Bought by
1992 Chi Guimond Family Trust and Guimond Chi Thi Tr
Current Estimated Value
Purchase Details
Closed on
Feb 15, 2019
Sold by
Davidson James D
Bought by
Casco Roger
Home Financials for this Owner
Home Financials are based on the most recent Mortgage that was taken out on this home.
Original Mortgage
$188,100
Interest Rate
4.4%
Mortgage Type
New Conventional
Purchase Details
Closed on
Oct 23, 2007
Sold by
Castle Hms Pt South Llc
Bought by
Davidson James D and Davidson Freida M
Home Financials for this Owner
Home Financials are based on the most recent Mortgage that was taken out on this home.
Original Mortgage
$174,561
Interest Rate
6.26%
Mortgage Type
Trade
Purchase Details
Closed on
Nov 21, 2005
Sold by
Gwd Inc
Bought by
Castle Homes Pointe South Llc
Purchase Details
Closed on
Aug 31, 2004
Bought by
Gwd Inc
Create a Home Valuation Report for This Property
The Home Valuation Report is an in-depth analysis detailing your home's value as well as a comparison with similar homes in the area
Home Values in the Area
Average Home Value in this Area
Purchase History
| Date | Buyer | Sale Price | Title Company |
|---|---|---|---|
| 1992 Chi Guimond Family Trust | $349,500 | -- | |
| Casco Roger | $209,000 | -- | |
| Davidson James D | $171,900 | -- | |
| Castle Homes Pointe South Llc | $3,948,000 | -- | |
| Gwd Inc | -- | -- |
Source: Public Records
Mortgage History
| Date | Status | Borrower | Loan Amount |
|---|---|---|---|
| Previous Owner | Casco Roger | $188,100 | |
| Previous Owner | Davidson James D | $174,561 |
Source: Public Records
Tax History Compared to Growth
Tax History
| Year | Tax Paid | Tax Assessment Tax Assessment Total Assessment is a certain percentage of the fair market value that is determined by local assessors to be the total taxable value of land and additions on the property. | Land | Improvement |
|---|---|---|---|---|
| 2024 | $3,202 | $127,441 | $26,800 | $100,641 |
| 2023 | $3,199 | $127,841 | $26,800 | $101,041 |
| 2022 | $2,992 | $102,696 | $24,000 | $78,696 |
| 2021 | $2,481 | $79,710 | $20,000 | $59,710 |
| 2020 | $2,486 | $79,710 | $20,000 | $59,710 |
| 2019 | $2,182 | $73,253 | $20,000 | $53,253 |
| 2018 | $1,848 | $61,648 | $13,200 | $48,448 |
| 2017 | $1,785 | $61,316 | $16,000 | $45,316 |
| 2016 | $1,478 | $50,661 | $16,000 | $34,661 |
| 2015 | $1,496 | $51,033 | $16,000 | $35,033 |
| 2014 | -- | $44,226 | $8,820 | $35,406 |
| 2013 | -- | $41,960 | $8,820 | $33,140 |
Source: Public Records
Map
Nearby Homes
- 1758 Miller Springs Dr
- 704 Newnham Walk
- 117 Kensington Trace
- 50 Gillis Ln
- 524 Otway Loop
- 132 Galilee Ln
- 173 Hynes St
- 554 Otway Loop
- 102 Galilee Ln
- Lancaster Plan at The Estates at Casteel
- Buckley Plan at The Estates at Casteel
- Cardiff Plan at The Estates at Casteel
- Pearson Plan at The Estates at Casteel
- Savoy Plan at The Estates at Casteel
- Hampstead Plan at The Estates at Casteel
- Pembroke Plan at The Estates at Casteel
- Europa Plan at Casteel
- Astro Plan at Casteel
- Solstice Plan at Casteel
- Galileo Plan at Casteel
- 1505 Pointe Cir S
- 1503 Pointe South Cir
- 1507 Pointe South Cir
- 1503 Pointe Cir S Unit 2
- 1503 Pointe Cir S
- 1507 Pointe Cir S
- 1509 Pointe Cir S
- 1509 Pointe South Cir
- 1501 Pointe South Cir
- 1501 Pointe Cir S
- 220 Pointe Cir S
- 1506 Pointe Cir S
- 1504 Pointe South Cir
- 1504 Pointe Cir S
- 1506 Pointe South Cir
- 1502 Pointe South Cir
- 1508 Pointe Cir S
- 1511 Pointe South Cir
- 1511 Pointe South Cir
- 1508 Pointe South Cir