
Seller's Agent in 2022
Jim Fulgenzi
RE/MAX Professionals
(217) 341-5393
6 in this area
699 Total Sales

Estimated Value: $53,000 - $117,000
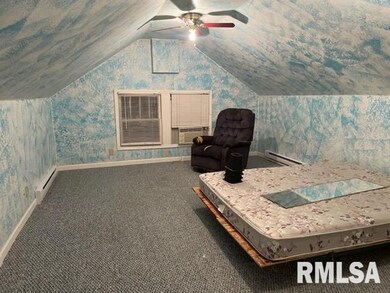
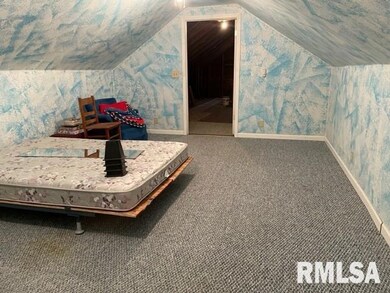
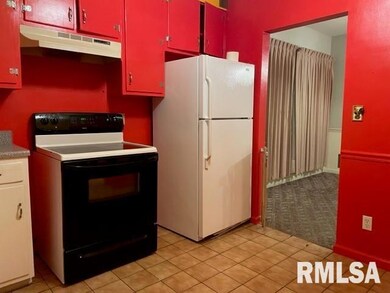
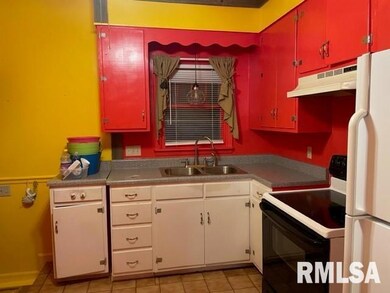
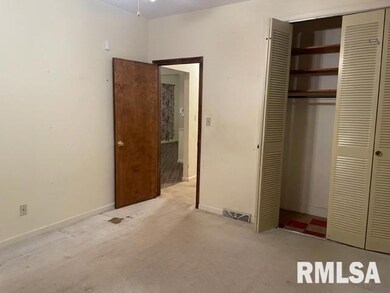
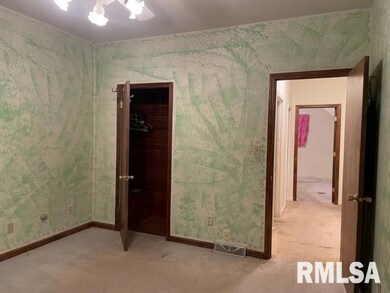
This home is located at 1505 S 7th St, Springfield, IL 62703 since 26 October 2022 and is currently estimated at $75,945, approximately $63 per square foot. This property was built in 1947. 1505 S 7th St is a home located in Sangamon County with nearby schools including Edwin A. Lee Elementary School, Jefferson Middle School, and Springfield Southeast High School.
Last Agent to Sell the Property
RE/MAX Professionals License #471021607 Listed on: 10/26/2022
| Date | Buyer | Sale Price | Title Company |
|---|---|---|---|
| Jlp Properties Llc | $45,900 | -- | |
| -- | $48,500 | -- | |
| -- | $51,900 | -- |
| Date | Status | Borrower | Loan Amount |
|---|---|---|---|
| Open | Jlp Properties Llc | $46,500 |
| Date | Event | Price | List to Sale | Price per Sq Ft |
|---|---|---|---|---|
| 12/01/2022 12/01/22 | Sold | $45,900 | 0.0% | $38 / Sq Ft |
| 11/07/2022 11/07/22 | Pending | -- | -- | -- |
| 10/26/2022 10/26/22 | For Sale | $45,900 | -- | $38 / Sq Ft |
| Year | Tax Paid | Tax Assessment Tax Assessment Total Assessment is a certain percentage of the fair market value that is determined by local assessors to be the total taxable value of land and additions on the property. | Land | Improvement |
|---|---|---|---|---|
| 2024 | $1,676 | $19,959 | $3,073 | $16,886 |
| 2023 | $1,612 | $18,231 | $2,807 | $15,424 |
| 2022 | $847 | $15,457 | $2,663 | $12,794 |
| 2021 | $799 | $14,878 | $2,563 | $12,315 |
| 2020 | $1,126 | $18,783 | $2,566 | $16,217 |
| 2019 | $1,103 | $18,717 | $2,557 | $16,160 |
| 2018 | $1,245 | $20,738 | $2,546 | $18,192 |
| 2017 | $1,213 | $20,470 | $2,513 | $17,957 |
| 2016 | $1,182 | $20,171 | $2,476 | $17,695 |
| 2015 | $1,164 | $19,929 | $2,446 | $17,483 |
| 2014 | $1,144 | $19,800 | $2,430 | $17,370 |
| 2013 | $1,118 | $19,800 | $2,430 | $17,370 |
Seller's Agent in 2022
Jim Fulgenzi
RE/MAX Professionals
(217) 341-5393
6 in this area
699 Total Sales
Buyer's Agent in 2022
KATHY GARST
The Real Estate Group, Inc.
(217) 306-6063
5 in this area
755 Total Sales
Source: RMLS Alliance
MLS Number: RMACA1018870
APN: 22-03.0-105-008
Disclaimer: Certain information contained herein is derived from information provided by parties other than Homes.com. All information provided is deemed reliable, but is not guaranteed to be accurate and should be independently verified.
![]() Based on information submitted to the MLS GRID. All data is obtained from various sources and may not have been verified by broker or MLS GRID. Supplied Open House Information is subject to change without notice. All information should be independently reviewed and verified for accuracy. Properties may or may not be listed by the office/agent presenting the information. Some IDX listings have been excluded from this website.IDX information is provided exclusively for personal, non-commercial use, and may not be used for any purpose other than to identify prospective properties consumers may be interested in purchasing. Information is deemed reliable but not guaranteed.
Based on information submitted to the MLS GRID. All data is obtained from various sources and may not have been verified by broker or MLS GRID. Supplied Open House Information is subject to change without notice. All information should be independently reviewed and verified for accuracy. Properties may or may not be listed by the office/agent presenting the information. Some IDX listings have been excluded from this website.IDX information is provided exclusively for personal, non-commercial use, and may not be used for any purpose other than to identify prospective properties consumers may be interested in purchasing. Information is deemed reliable but not guaranteed.
Based on information submitted to the MLS GRID
Ask me questions while you tour the home.