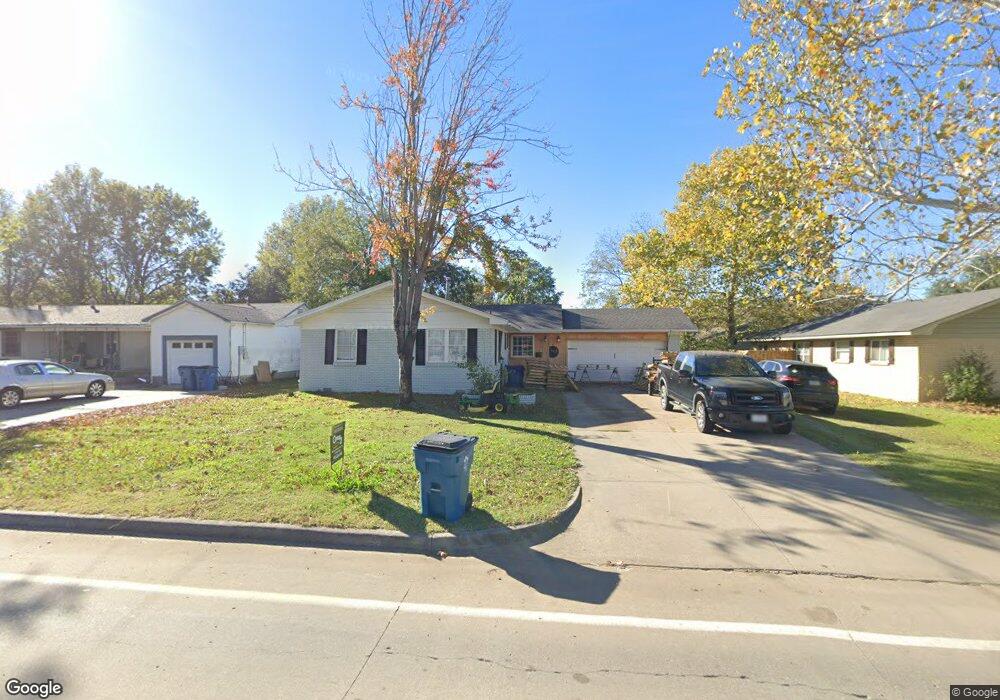
1505 S 9th St McAlester, OK 74501
Estimated Value: $139,188 - $166,000
3
Beds
2
Baths
1,230
Sq Ft
$121/Sq Ft
Est. Value
About This Home
This home is located at 1505 S 9th St, McAlester, OK 74501 and is currently estimated at $149,047, approximately $121 per square foot. 1505 S 9th St is a home located in Pittsburg County with nearby schools including McAlester High School, Mcalester Christian Academy, and Lakewood Christian School.
Ownership History
Date
Name
Owned For
Owner Type
Purchase Details
Closed on
Apr 30, 2010
Sold by
Maw Eugene A and Maw Robin R
Bought by
Cochran Bradley J
Current Estimated Value
Home Financials for this Owner
Home Financials are based on the most recent Mortgage that was taken out on this home.
Original Mortgage
$98,671
Outstanding Balance
$65,271
Interest Rate
5.02%
Mortgage Type
FHA
Estimated Equity
$83,776
Purchase Details
Closed on
Sep 5, 2008
Sold by
Nick Johnny L and Nick Barbara D
Bought by
Maw Eugene A and Maw Robin R
Purchase Details
Closed on
Aug 16, 2007
Sold by
Parks Guy T and Parks Hilda
Bought by
Nick Johnny L and Nick Barbara D
Home Financials for this Owner
Home Financials are based on the most recent Mortgage that was taken out on this home.
Original Mortgage
$87,500
Interest Rate
6.72%
Mortgage Type
Future Advance Clause Open End Mortgage
Create a Home Valuation Report for This Property
The Home Valuation Report is an in-depth analysis detailing your home's value as well as a comparison with similar homes in the area
Home Values in the Area
Average Home Value in this Area
Purchase History
| Date | Buyer | Sale Price | Title Company |
|---|---|---|---|
| Cochran Bradley J | $100,000 | None Available | |
| Maw Eugene A | $103,000 | None Available | |
| Nick Johnny L | $82,500 | None Available | |
| Nick Johnny L | -- | None Available |
Source: Public Records
Mortgage History
| Date | Status | Borrower | Loan Amount |
|---|---|---|---|
| Open | Cochran Bradley J | $98,671 | |
| Previous Owner | Nick Johnny L | $87,500 |
Source: Public Records
Tax History Compared to Growth
Tax History
| Year | Tax Paid | Tax Assessment Tax Assessment Total Assessment is a certain percentage of the fair market value that is determined by local assessors to be the total taxable value of land and additions on the property. | Land | Improvement |
|---|---|---|---|---|
| 2025 | $816 | $9,279 | $1,652 | $7,627 |
| 2024 | $816 | $10,092 | $1,652 | $8,440 |
| 2023 | $885 | $10,176 | $1,652 | $8,524 |
| 2022 | $891 | $10,176 | $1,652 | $8,524 |
| 2021 | $886 | $10,176 | $1,652 | $8,524 |
| 2020 | $892 | $10,176 | $1,652 | $8,524 |
| 2019 | $833 | $10,345 | $1,652 | $8,693 |
| 2018 | $835 | $10,345 | $1,652 | $8,693 |
| 2017 | $843 | $10,345 | $1,652 | $8,693 |
| 2016 | $839 | $10,345 | $1,652 | $8,693 |
| 2015 | $843 | $11,330 | $719 | $10,611 |
| 2014 | $843 | $11,330 | $719 | $10,611 |
Source: Public Records
Map
Nearby Homes
- 1600 S 9th St
- 806 Lampton Ln
- 1407 S 9th St
- 622 Indiana Ave
- 701 Lampton Ln
- 605 Mcarthur Ln
- 1705 Virginia Dr
- 1708 Louise Dr
- 1709 Virginia Dr
- 1710 Louise Dr
- 609 Garden Ln
- 500 Garden Ln
- 506 Garden Ln
- 0 Oklahoma Ave
- 0 Ono Ct
- 1526 S 5th St
- 1002 E Creek Ave
- 1533 Red Bud Ln
- 1800 Mockingbird Ln
- 1306 S 6th St