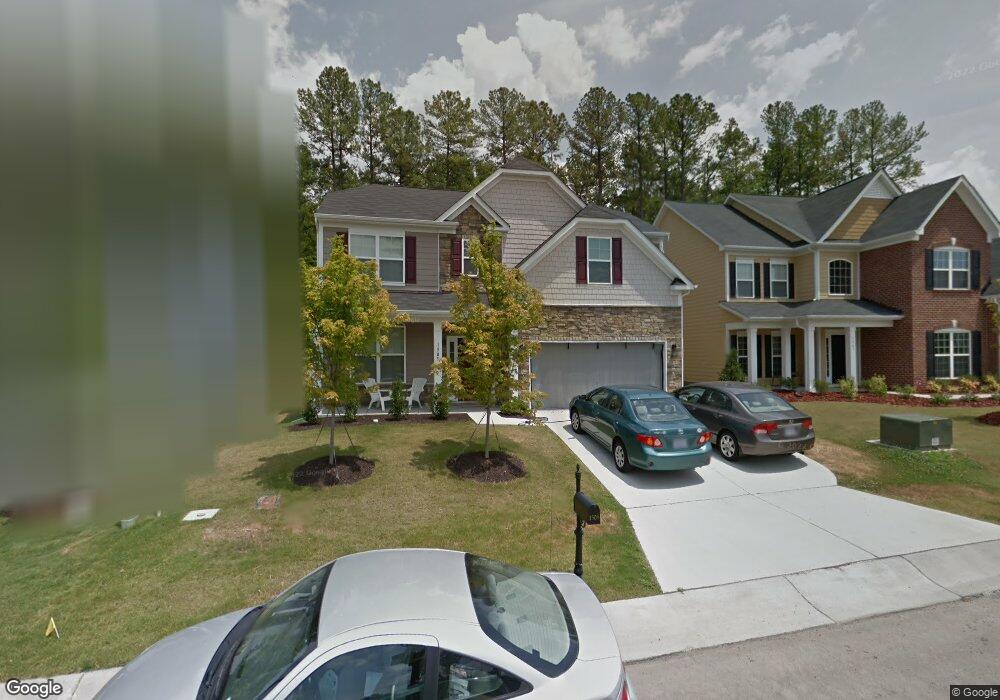
1505 Willowcrest Rd Durham, NC 27703
Eastern Durham NeighborhoodEstimated Value: $421,145 - $458,000
3
Beds
3
Baths
2,461
Sq Ft
$177/Sq Ft
Est. Value
About This Home
This home is located at 1505 Willowcrest Rd, Durham, NC 27703 and is currently estimated at $434,536, approximately $176 per square foot. 1505 Willowcrest Rd is a home located in Durham County with nearby schools including Spring Valley Elementary School, John W Neal Middle School, and Southern School of Energy & Sustainability.
Ownership History
Date
Name
Owned For
Owner Type
Purchase Details
Closed on
Jul 23, 2019
Sold by
Long Wel and Yang Yonghui
Bought by
Good News Real Estate Investment Llc
Current Estimated Value
Purchase Details
Closed on
Aug 24, 2018
Sold by
Roberson Carla and Jenkins Tony
Bought by
Long Wei and Yang Yonghui
Purchase Details
Closed on
Aug 22, 2014
Sold by
Sullivan Brian J and Sullivan Katherine D
Bought by
Roberson Carla
Home Financials for this Owner
Home Financials are based on the most recent Mortgage that was taken out on this home.
Original Mortgage
$219,942
Interest Rate
4.4%
Mortgage Type
FHA
Purchase Details
Closed on
Mar 31, 2011
Sold by
Hearthstone Multi Asset Entity B Lp
Bought by
Sullivan Brian J and Sullivan Katherine D
Home Financials for this Owner
Home Financials are based on the most recent Mortgage that was taken out on this home.
Original Mortgage
$197,405
Interest Rate
4.25%
Mortgage Type
FHA
Create a Home Valuation Report for This Property
The Home Valuation Report is an in-depth analysis detailing your home's value as well as a comparison with similar homes in the area
Home Values in the Area
Average Home Value in this Area
Purchase History
| Date | Buyer | Sale Price | Title Company |
|---|---|---|---|
| Good News Real Estate Investment Llc | -- | None Available | |
| Long Wei | $270,000 | None Available | |
| Roberson Carla | $224,000 | None Available | |
| Sullivan Brian J | $203,000 | None Available |
Source: Public Records
Mortgage History
| Date | Status | Borrower | Loan Amount |
|---|---|---|---|
| Previous Owner | Roberson Carla | $219,942 | |
| Previous Owner | Sullivan Brian J | $197,405 |
Source: Public Records
Tax History Compared to Growth
Tax History
| Year | Tax Paid | Tax Assessment Tax Assessment Total Assessment is a certain percentage of the fair market value that is determined by local assessors to be the total taxable value of land and additions on the property. | Land | Improvement |
|---|---|---|---|---|
| 2025 | $3,597 | $431,409 | $98,600 | $332,809 |
| 2024 | $3,597 | $257,853 | $43,425 | $214,428 |
| 2023 | $3,378 | $257,853 | $43,425 | $214,428 |
| 2022 | $3,300 | $257,853 | $43,425 | $214,428 |
| 2021 | $3,285 | $257,853 | $43,425 | $214,428 |
| 2020 | $3,207 | $257,853 | $43,425 | $214,428 |
| 2019 | $3,207 | $257,853 | $43,425 | $214,428 |
| 2018 | $3,073 | $226,562 | $46,320 | $180,242 |
| 2017 | $3,051 | $226,562 | $46,320 | $180,242 |
| 2016 | $2,948 | $226,562 | $46,320 | $180,242 |
| 2015 | $3,267 | $236,035 | $47,388 | $188,647 |
| 2014 | $3,267 | $236,035 | $47,388 | $188,647 |
Source: Public Records
Map
Nearby Homes
- 1607 Willowcrest Rd
- 144 Daneborg Rd
- 148 Daneborg Rd
- 104 Elmsford St
- 110 Elmsford St
- 140 Token House Rd
- 1107 High Fox Dr
- 111 Glenview Ln
- 543 Callandale Ln
- 3465 Delmar Dr
- 3463 Delmar Dr
- 3459 Delmar Dr
- 3457 Delmar Dr
- 3461 Delmar Dr
- 1613 Waddell Ct
- 533 Kings Lake Way
- 1525 S Mineral Springs Rd
- Winstead III Plan at Mica Ridge - Sterling Collection
- Nelson Plan at Mica Ridge - Sterling Collection
- Somerset III Plan at Mica Ridge - Sterling Collection
- 1503 Willowcrest Rd
- 1507 Willowcrest Rd
- 1501 Willowcrest Rd
- 1509 Willowcrest Rd
- 101 Elmsford St
- 1499 Willowcrest Rd
- 202 Ashton Glen
- 1497 Willowcrest Rd
- 103 Elmsford St
- 204 Ashton Glen
- 147 Ashton Glen
- 137 Ashton Glen
- 139 Ashton Glen
- 135 Ashton Glen
- 1495 Willowcrest Rd
- 1603 Willowcrest Rd
- 105 Elmsford St
- 206 Ashton Glen
- 141 Daneborg Rd
- 201 Ashton Glen