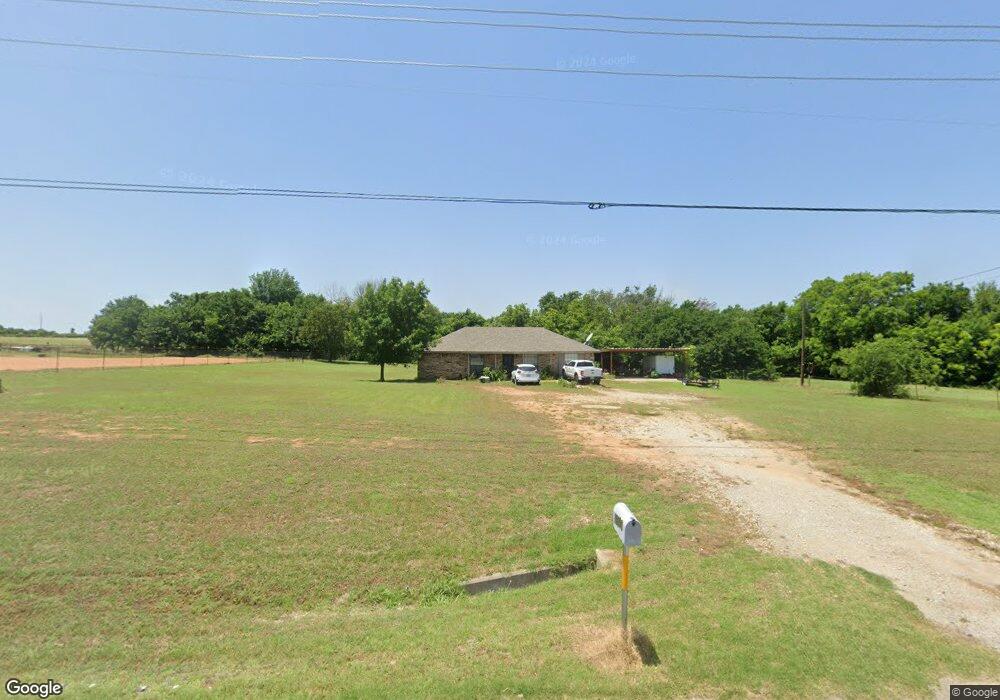
15051 Fm 920 Poolville, TX 76487
Estimated Value: $267,309 - $334,000
2
Beds
2
Baths
1,377
Sq Ft
$217/Sq Ft
Est. Value
About This Home
This home is located at 15051 Fm 920, Poolville, TX 76487 and is currently estimated at $299,327, approximately $217 per square foot. 15051 Fm 920 is a home located in Parker County with nearby schools including Poolville Elementary School, Poolville J High School, and Poolville High School.
Ownership History
Date
Name
Owned For
Owner Type
Purchase Details
Closed on
Sep 21, 2011
Sold by
Remor Toni R and Remor Barry C
Bought by
Altizer William Phillip
Current Estimated Value
Home Financials for this Owner
Home Financials are based on the most recent Mortgage that was taken out on this home.
Original Mortgage
$97,102
Outstanding Balance
$66,431
Interest Rate
4.24%
Mortgage Type
VA
Estimated Equity
$232,896
Purchase Details
Closed on
Apr 18, 2006
Sold by
Bailey Rodney E
Bought by
Altizer William Phillip
Purchase Details
Closed on
Jan 27, 2006
Bought by
Altizer William Phillip
Home Financials for this Owner
Home Financials are based on the most recent Mortgage that was taken out on this home.
Original Mortgage
$62,400
Interest Rate
6.24%
Mortgage Type
New Conventional
Purchase Details
Closed on
Nov 15, 1990
Bought by
Altizer William Phillip
Create a Home Valuation Report for This Property
The Home Valuation Report is an in-depth analysis detailing your home's value as well as a comparison with similar homes in the area
Home Values in the Area
Average Home Value in this Area
Purchase History
| Date | Buyer | Sale Price | Title Company |
|---|---|---|---|
| Altizer William Phillip | -- | Providence Title | |
| Altizer William Phillip | -- | -- | |
| Altizer William Phillip | -- | -- | |
| Remor Toni R | -- | None Available | |
| Altizer William Phillip | -- | -- |
Source: Public Records
Mortgage History
| Date | Status | Borrower | Loan Amount |
|---|---|---|---|
| Open | Altizer William Phillip | $97,102 | |
| Previous Owner | Remor Toni R | $62,400 |
Source: Public Records
Tax History Compared to Growth
Tax History
| Year | Tax Paid | Tax Assessment Tax Assessment Total Assessment is a certain percentage of the fair market value that is determined by local assessors to be the total taxable value of land and additions on the property. | Land | Improvement |
|---|---|---|---|---|
| 2025 | $865 | $248,534 | -- | -- |
| 2024 | $865 | $225,940 | -- | -- |
| 2023 | $865 | $205,400 | $0 | $0 |
| 2022 | $3,329 | $195,740 | $40,000 | $155,740 |
| 2021 | $3,104 | $195,740 | $40,000 | $155,740 |
| 2020 | $2,950 | $159,970 | $20,000 | $139,970 |
| 2019 | $2,890 | $159,970 | $20,000 | $139,970 |
| 2018 | $2,667 | $127,540 | $12,000 | $115,540 |
| 2017 | $2,563 | $127,540 | $12,000 | $115,540 |
| 2016 | $2,330 | $114,020 | $11,000 | $103,020 |
| 2015 | $1,176 | $114,020 | $11,000 | $103,020 |
| 2014 | $1,303 | $90,240 | $11,000 | $79,240 |
Source: Public Records
Map
Nearby Homes
- 2007 Brown Loop
- 269 Zebrastone Way
- 399 Erwin Rd Unit 393,395,397,399
- 101 Lone Star Rd
- 140 Pine Rd
- 1021 Carnagie Rd
- 1033 Carnagie Rd
- 1029 Carnagie Rd
- 1045 Carnagie Rd
- 506 Pecan Tree Ct
- 957 Erwin Rd
- 509 Pecan Tree Ct
- 13010 W 199 Highwat
- 304 Zion Forest Trail
- 408 Pecan Tree Ct
- 1115 Paradise Pkwy
- 1099 Paradise Pkwy
- 1053 Paradise Pkwy
- 1048 Paradise Pkwy
- 1052 Paradise Pkwy