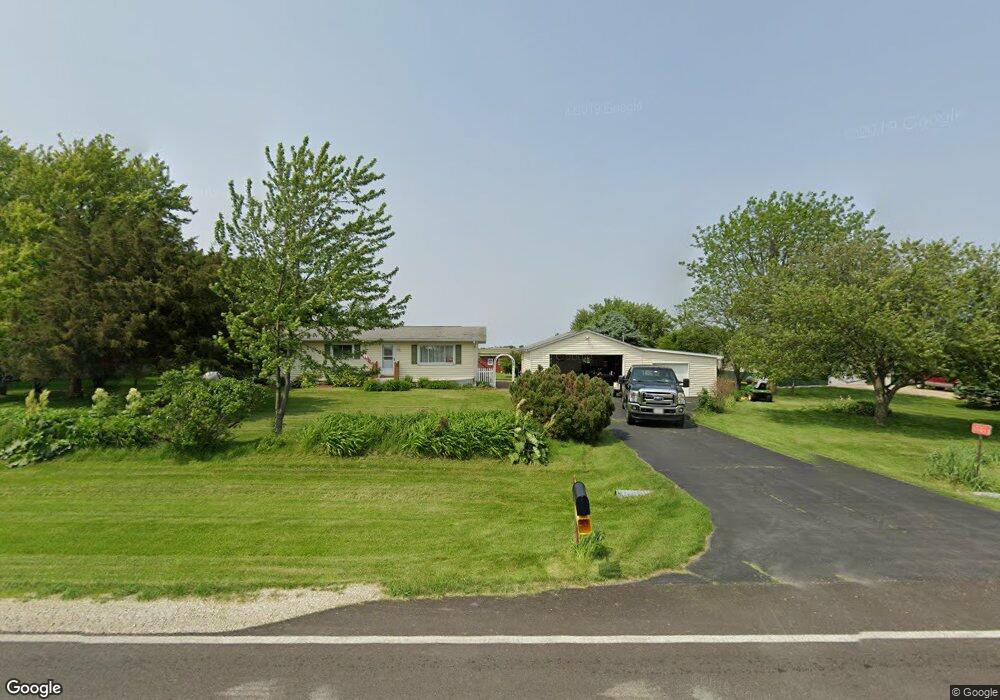
15053 North St Maple Park, IL 60151
Estimated Value: $285,113 - $353,000
3
Beds
1
Bath
1,196
Sq Ft
$270/Sq Ft
Est. Value
About This Home
This home is located at 15053 North St, Maple Park, IL 60151 and is currently estimated at $323,278, approximately $270 per square foot. 15053 North St is a home located in DeKalb County with nearby schools including Cortland Elementary School, Huntley Middle School, and De Kalb High School.
Ownership History
Date
Name
Owned For
Owner Type
Purchase Details
Closed on
Aug 25, 2006
Sold by
Peterson Thomas C
Bought by
Lamesch John M
Current Estimated Value
Home Financials for this Owner
Home Financials are based on the most recent Mortgage that was taken out on this home.
Original Mortgage
$205,000
Outstanding Balance
$123,846
Interest Rate
6.78%
Mortgage Type
New Conventional
Estimated Equity
$199,432
Create a Home Valuation Report for This Property
The Home Valuation Report is an in-depth analysis detailing your home's value as well as a comparison with similar homes in the area
Home Values in the Area
Average Home Value in this Area
Purchase History
| Date | Buyer | Sale Price | Title Company |
|---|---|---|---|
| Lamesch John M | $205,000 | -- |
Source: Public Records
Mortgage History
| Date | Status | Borrower | Loan Amount |
|---|---|---|---|
| Open | Lamesch John M | $205,000 |
Source: Public Records
Tax History
| Year | Tax Paid | Tax Assessment Tax Assessment Total Assessment is a certain percentage of the fair market value that is determined by local assessors to be the total taxable value of land and additions on the property. | Land | Improvement |
|---|---|---|---|---|
| 2024 | $5,091 | $78,952 | $18,431 | $60,521 |
| 2023 | $5,091 | $73,863 | $17,243 | $56,620 |
| 2022 | $5,125 | $70,493 | $16,456 | $54,037 |
| 2021 | $5,783 | $67,117 | $15,668 | $51,449 |
| 2020 | $5,699 | $65,023 | $15,179 | $49,844 |
| 2019 | $5,523 | $62,294 | $14,542 | $47,752 |
| 2018 | $5,372 | $59,207 | $14,047 | $45,160 |
| 2017 | $5,323 | $56,366 | $13,373 | $42,993 |
| 2016 | $4,992 | $52,976 | $12,569 | $40,407 |
| 2015 | -- | $49,747 | $11,803 | $37,944 |
| 2014 | -- | $47,880 | $11,360 | $36,520 |
| 2013 | -- | $49,617 | $11,772 | $37,845 |
Source: Public Records
Map
Nearby Homes
- 448 Preston St
- 446 Preston St
- 505 Preston St
- 507 Preston St
- 152 Llanos St
- 154 Llanos St
- Lot A16 Llanos St
- Lot B16 Llanos St
- 154 S Llanos St
- 152 S Llanos St
- 58 E Clover Ave
- 103 E Daisy Ave
- 86 E Daisy Ave
- Lot B6 W Paw Ave
- 95 Lots Chestnut Grove
- 192 S Joslyn St
- 300 N Aspen Dr
- 329 N Aspen Dr
- 335 N Aspen Dr
- 347 N Aspen Dr
- 15021 North St
- 15113 North St
- 15241 North St
- 15023 North St
- 15275 North St
- 15423 North St
- 15459 North St
- 20211 Airport Rd
- 20132 Airport Rd
- 20608 Airport Rd
- 19671 Airport Rd
- 19625 Airport Rd
- 19651 Airport Rd
- 19602 Airport Rd
- 14667 Pleasant St
- 19574 Airport Rd
- 19552 Airport Rd
- 19528 Airport Rd
- 370 E North Ave
- 15029 Il Route 38
Your Personal Tour Guide
Ask me questions while you tour the home.