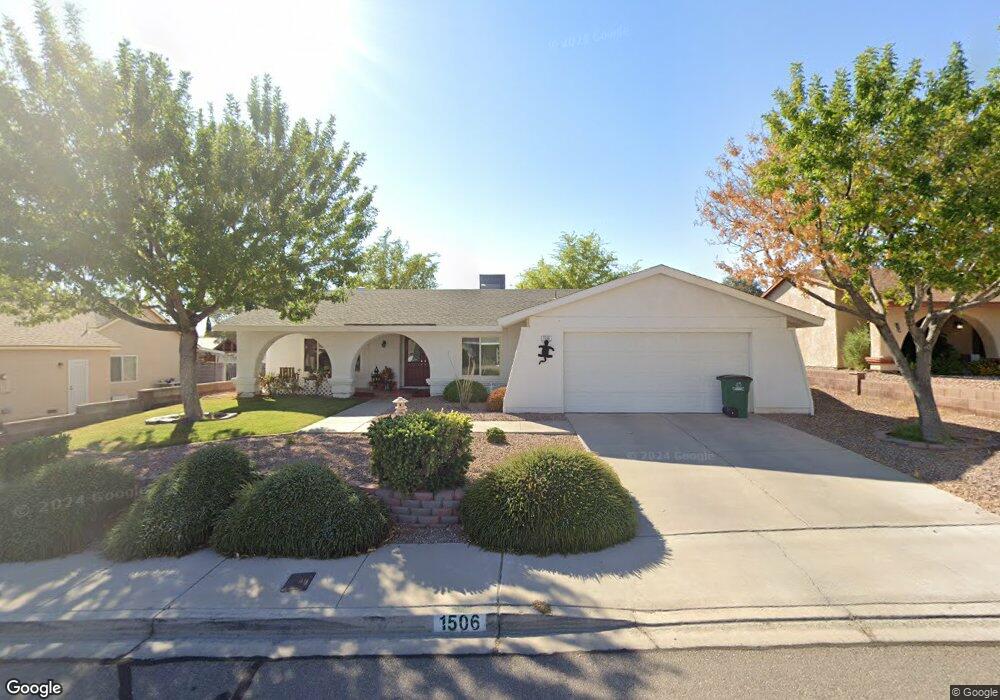
1506 Darlene Way Boulder City, NV 89005
Estimated Value: $450,000 - $471,000
2
Beds
2
Baths
1,562
Sq Ft
$294/Sq Ft
Est. Value
About This Home
This home is located at 1506 Darlene Way, Boulder City, NV 89005 and is currently estimated at $459,573, approximately $294 per square foot. 1506 Darlene Way is a home located in Clark County with nearby schools including Andrew Mitchell Elementary School, Martha P. King Elementary School, and Elton M. & Madelaine E. Garrett Junior High School.
Ownership History
Date
Name
Owned For
Owner Type
Purchase Details
Closed on
Nov 18, 1998
Sold by
Schade Lois S
Bought by
Schade Lois S and Lois S Schade Trust
Current Estimated Value
Home Financials for this Owner
Home Financials are based on the most recent Mortgage that was taken out on this home.
Original Mortgage
$130,500
Outstanding Balance
$28,360
Interest Rate
6.54%
Estimated Equity
$431,213
Purchase Details
Closed on
Nov 2, 1998
Sold by
Thomas Thomas William William
Bought by
Schade Thomas Lois Seeger
Home Financials for this Owner
Home Financials are based on the most recent Mortgage that was taken out on this home.
Original Mortgage
$130,500
Outstanding Balance
$28,360
Interest Rate
6.54%
Estimated Equity
$431,213
Purchase Details
Closed on
Oct 27, 1998
Sold by
Chandler Gertrude D
Bought by
Schade Lois S
Home Financials for this Owner
Home Financials are based on the most recent Mortgage that was taken out on this home.
Original Mortgage
$130,500
Outstanding Balance
$28,360
Interest Rate
6.54%
Estimated Equity
$431,213
Create a Home Valuation Report for This Property
The Home Valuation Report is an in-depth analysis detailing your home's value as well as a comparison with similar homes in the area
Home Values in the Area
Average Home Value in this Area
Purchase History
| Date | Buyer | Sale Price | Title Company |
|---|---|---|---|
| Schade Lois S | -- | United Title | |
| Schade Thomas Lois Seeger | -- | United Title | |
| Schade Lois S | $145,000 | United Title |
Source: Public Records
Mortgage History
| Date | Status | Borrower | Loan Amount |
|---|---|---|---|
| Open | Schade Lois S | $130,500 |
Source: Public Records
Tax History Compared to Growth
Tax History
| Year | Tax Paid | Tax Assessment Tax Assessment Total Assessment is a certain percentage of the fair market value that is determined by local assessors to be the total taxable value of land and additions on the property. | Land | Improvement |
|---|---|---|---|---|
| 2025 | $1,591 | $84,581 | $51,800 | $32,781 |
| 2024 | $1,544 | $84,581 | $51,800 | $32,781 |
| 2023 | $1,261 | $72,146 | $39,900 | $32,246 |
| 2022 | $1,499 | $65,005 | $35,000 | $30,005 |
| 2021 | $1,456 | $59,444 | $30,450 | $28,994 |
| 2020 | $1,413 | $59,608 | $30,450 | $29,158 |
| 2019 | $1,372 | $55,415 | $26,250 | $29,165 |
| 2018 | $1,332 | $51,561 | $23,100 | $28,461 |
| 2017 | $1,356 | $51,937 | $22,750 | $29,187 |
| 2016 | $1,261 | $50,244 | $20,300 | $29,944 |
| 2015 | $1,258 | $47,422 | $17,500 | $29,922 |
| 2014 | $1,221 | $45,784 | $15,750 | $30,034 |
Source: Public Records
Map
Nearby Homes
- 776 San Remo Way
- 782 Sandra Dr
- 798 Fairway Dr
- 1316 Capri Dr Unit A,B,C,&D
- 1321 Nadine Way
- 1527 Irene Dr
- 1546 Georgia Ave
- 893 Fairway Dr
- 976 El Camino Way
- 1303 Darlene Way Unit 105C
- 1303 Darlene Way Unit 102B
- 1413 Pueblo Dr
- 1300 Georgia Ave Unit A
- 1427 San Felipe Dr
- 839 Benita Place
- 1000 Legacy Dr
- 834 Benita Place
- 1201 I
- 873 Montera Ln
- 855 Del Rey Dr
- 1508 Darlene Way
- 1504 Darlene Way
- 1507 Christina Dr
- 1509 Christina Dr
- 1502 Darlene Way
- 1505 Christina Dr
- 1510 Darlene Way
- 1511 Christina Dr
- 1507 Darlene Way
- 1507 Darlene Way Unit N/a
- 1503 Darlene Way
- 1503 Christina Dr
- 1509 Darlene Way
- 1513 Christina Dr
- 1512 Darlene Way
- 1500 Darlene Way
- 1501 Darlene Way
- 1501 Christina Dr
- 1511 Darlene Way
- 786 San Remo Way