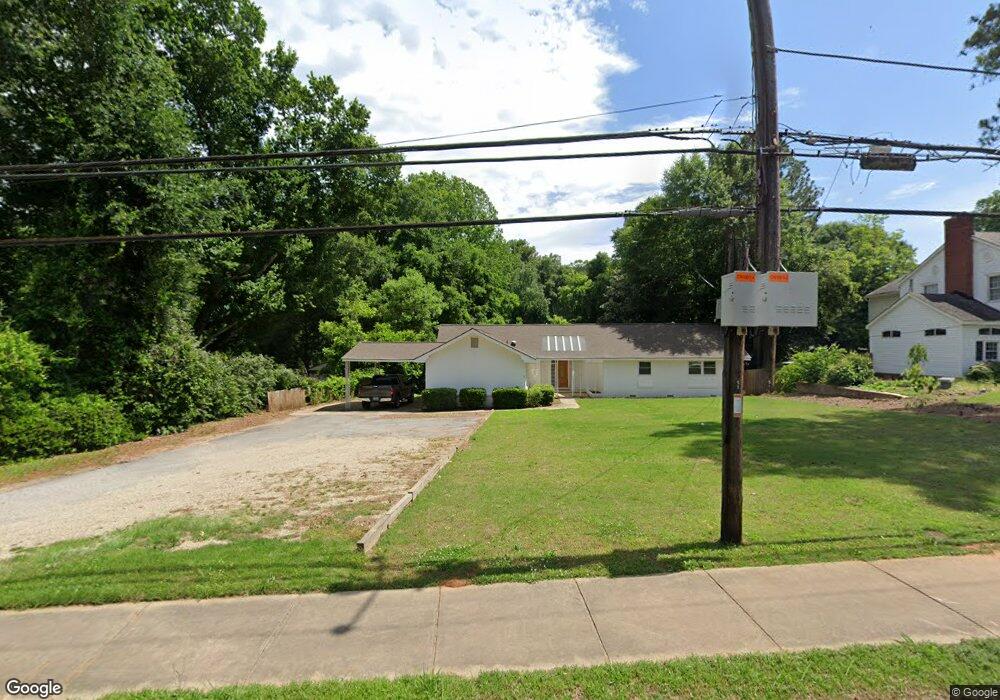
1506 Maple St Carrollton, GA 30117
Estimated Value: $321,000 - $500,000
3
Beds
2
Baths
2,526
Sq Ft
$149/Sq Ft
Est. Value
About This Home
This home is located at 1506 Maple St, Carrollton, GA 30117 and is currently estimated at $376,156, approximately $148 per square foot. 1506 Maple St is a home located in Carroll County with nearby schools including Carrollton Elementary School, Carrollton Upper Elementary School, and Carrollton Middle School.
Ownership History
Date
Name
Owned For
Owner Type
Purchase Details
Closed on
Oct 28, 2022
Sold by
Alpha Zeta House Association Inc
Bought by
Maclean Properties Llc
Current Estimated Value
Home Financials for this Owner
Home Financials are based on the most recent Mortgage that was taken out on this home.
Original Mortgage
$225,000
Outstanding Balance
$207,070
Interest Rate
6.92%
Mortgage Type
New Conventional
Estimated Equity
$169,086
Purchase Details
Closed on
Jul 31, 2013
Sold by
Kell Sheri Moore
Bought by
Moore Hazel
Home Financials for this Owner
Home Financials are based on the most recent Mortgage that was taken out on this home.
Original Mortgage
$413,407
Interest Rate
4.29%
Mortgage Type
New Conventional
Purchase Details
Closed on
Jul 22, 2013
Sold by
Moore Allan William
Bought by
Moore Hazel
Home Financials for this Owner
Home Financials are based on the most recent Mortgage that was taken out on this home.
Original Mortgage
$413,407
Interest Rate
4.29%
Mortgage Type
New Conventional
Create a Home Valuation Report for This Property
The Home Valuation Report is an in-depth analysis detailing your home's value as well as a comparison with similar homes in the area
Home Values in the Area
Average Home Value in this Area
Purchase History
| Date | Buyer | Sale Price | Title Company |
|---|---|---|---|
| Maclean Properties Llc | $300,000 | -- | |
| Moore Hazel | -- | -- | |
| Alpha Zeta House Association I | $190,000 | -- | |
| Moore Hazel | -- | -- | |
| Moore Hazel | -- | -- |
Source: Public Records
Mortgage History
| Date | Status | Borrower | Loan Amount |
|---|---|---|---|
| Open | Maclean Properties Llc | $225,000 | |
| Previous Owner | Alpha Zeta House Association I | $413,407 | |
| Previous Owner | Moore Hazel | $413,407 |
Source: Public Records
Tax History
| Year | Tax Paid | Tax Assessment Tax Assessment Total Assessment is a certain percentage of the fair market value that is determined by local assessors to be the total taxable value of land and additions on the property. | Land | Improvement |
|---|---|---|---|---|
| 2025 | $3,030 | $114,404 | $24,334 | $90,070 |
| 2024 | $3,126 | $114,404 | $24,334 | $90,070 |
| 2023 | $3,126 | $106,133 | $24,334 | $81,799 |
| 2022 | $2,390 | $81,877 | $24,334 | $57,543 |
| 2021 | $2,149 | $73,606 | $24,334 | $49,272 |
| 2020 | $2,011 | $68,806 | $24,334 | $44,472 |
| 2019 | $1,933 | $65,550 | $24,334 | $41,216 |
| 2018 | $1,831 | $61,201 | $24,334 | $36,867 |
| 2017 | $1,841 | $61,201 | $24,334 | $36,867 |
| 2016 | $1,851 | $61,201 | $24,334 | $36,867 |
| 2015 | $1,325 | $42,898 | $10,900 | $31,998 |
| 2014 | $1,331 | $42,898 | $10,900 | $31,998 |
Source: Public Records
Map
Nearby Homes
- HWY 166 Maple St
- HWY 166 W Maple St
- 142 Griffin Dr
- 141 Bowen St
- 145 Bowen St
- 145 Bowen St Unit B4
- 135 Beaver St
- 118 Park Ln
- 219 Broad St
- 119 Old Mill Ct
- 308 Old Mill Dr
- 115 Avenue B
- 310 Kramer St
- 160 Watson St
- 108 Briarwood Dr Unit 93
- 108 Briarwood Dr
- 0 Hwy 27 None N
- 211 Habersham Place
- 109 S Park St
- 109 7th St
- 1510 Maple St
- 1502 Maple St
- 121 Howell Rd
- 1514 Maple St
- 116 Howell Rd
- 110 Hillcrest Rd
- 129 Howell Rd
- 112 Hillcrest Rd
- 117 Howell Rd
- 119 Griffin Dr Unit 3
- 119 Griffin Dr Unit 1
- 1406 Maple St
- 166 Maple St
- 114 Hillcrest Rd
- 135 Griffin Dr
- 0 Sunset Blvd
- 136 Howell Rd
- 143 Griffin Dr
- 0 W Wiley Bridge Rd Unit 6973471
- 0 W Wiley Bridge Rd Unit 6604583
Your Personal Tour Guide
Ask me questions while you tour the home.