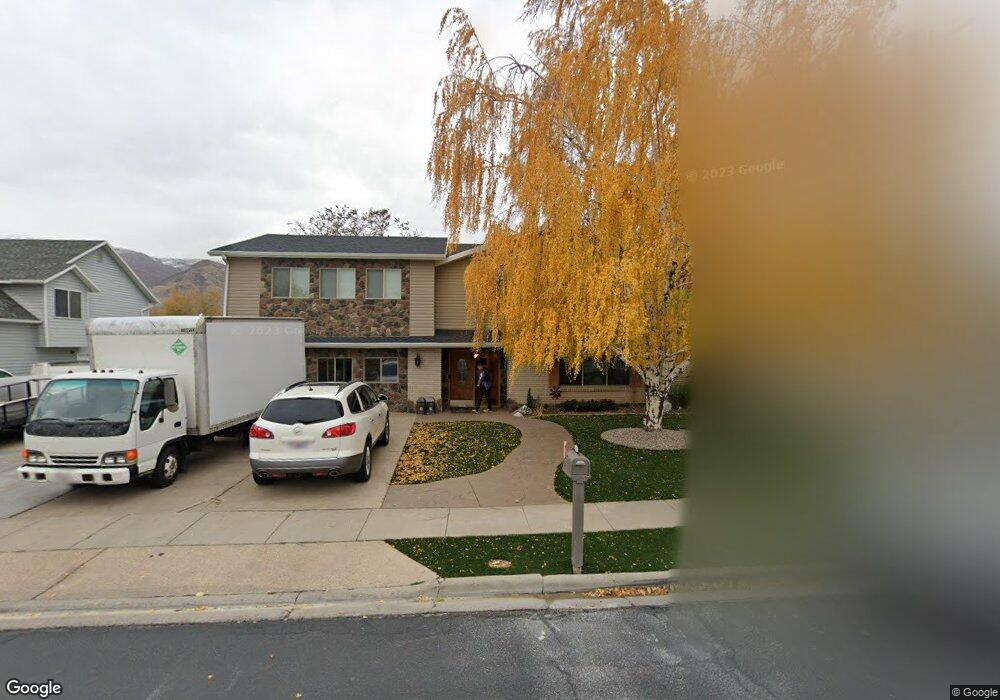
1506 N 600 W West Bountiful, UT 84087
Estimated Value: $564,000 - $729,000
3
Beds
3
Baths
3,341
Sq Ft
$196/Sq Ft
Est. Value
About This Home
This home is located at 1506 N 600 W, West Bountiful, UT 84087 and is currently estimated at $654,300, approximately $195 per square foot. 1506 N 600 W is a home located in Davis County with nearby schools including West Bountiful Elementary School, Bountiful Junior High School, and Viewmont High School.
Ownership History
Date
Name
Owned For
Owner Type
Purchase Details
Closed on
Apr 24, 2017
Sold by
Garrick John R and Garrieck Kaeleen
Bought by
Garrick Kaeleen and Garrick John R
Current Estimated Value
Home Financials for this Owner
Home Financials are based on the most recent Mortgage that was taken out on this home.
Original Mortgage
$281,084
Outstanding Balance
$234,921
Interest Rate
4.37%
Mortgage Type
FHA
Estimated Equity
$419,379
Purchase Details
Closed on
May 7, 1998
Sold by
Broderick Ronald J and Broderick Lorna J
Bought by
Garrick John R and Garrick Kaeleen
Home Financials for this Owner
Home Financials are based on the most recent Mortgage that was taken out on this home.
Original Mortgage
$140,000
Interest Rate
7.62%
Create a Home Valuation Report for This Property
The Home Valuation Report is an in-depth analysis detailing your home's value as well as a comparison with similar homes in the area
Home Values in the Area
Average Home Value in this Area
Purchase History
| Date | Buyer | Sale Price | Title Company |
|---|---|---|---|
| Garrick Kaeleen | -- | Backman Title | |
| Garrick John R | -- | First American Title Co |
Source: Public Records
Mortgage History
| Date | Status | Borrower | Loan Amount |
|---|---|---|---|
| Open | Garrick Kaeleen | $281,084 | |
| Closed | Garrick John R | $140,000 |
Source: Public Records
Tax History
| Year | Tax Paid | Tax Assessment Tax Assessment Total Assessment is a certain percentage of the fair market value that is determined by local assessors to be the total taxable value of land and additions on the property. | Land | Improvement |
|---|---|---|---|---|
| 2025 | $3,185 | $281,050 | $146,586 | $134,464 |
| 2024 | $2,998 | $270,600 | $120,731 | $149,869 |
| 2023 | $3,201 | $484,000 | $227,042 | $256,958 |
| 2022 | $3,020 | $257,400 | $109,976 | $147,424 |
| 2021 | $2,842 | $371,000 | $150,368 | $220,632 |
| 2020 | $2,476 | $311,000 | $137,939 | $173,061 |
| 2019 | $2,376 | $306,000 | $137,934 | $168,066 |
| 2018 | $2,179 | $283,000 | $136,234 | $146,766 |
| 2016 | $1,869 | $130,185 | $37,528 | $92,657 |
| 2015 | $1,814 | $119,735 | $37,528 | $82,207 |
| 2014 | $1,902 | $127,611 | $37,176 | $90,435 |
| 2013 | -- | $112,122 | $32,069 | $80,053 |
Source: Public Records
Map
Nearby Homes
- 1520 N 550 W
- 1449 N 725 W
- 1625 Pages Place
- 591 W 2050 N
- 366 W 1000 N
- 204 Lyman Ln
- 1130 N 200 W
- 3166 Linden Cir
- 563 N 200 W
- 65 W 850 S
- 988 W 1950 N Unit 134
- 330 W Paradiso Ln
- 18 W Lady Ln
- 1084 W Audrey Ln
- 499 N 200 W Unit 18
- 499 N 200 W Unit 19
- 998 W 1950 N
- 403 W 400 N Unit 1
- 312 W Escala Ln
- 16 W 780 S
Your Personal Tour Guide
Ask me questions while you tour the home.