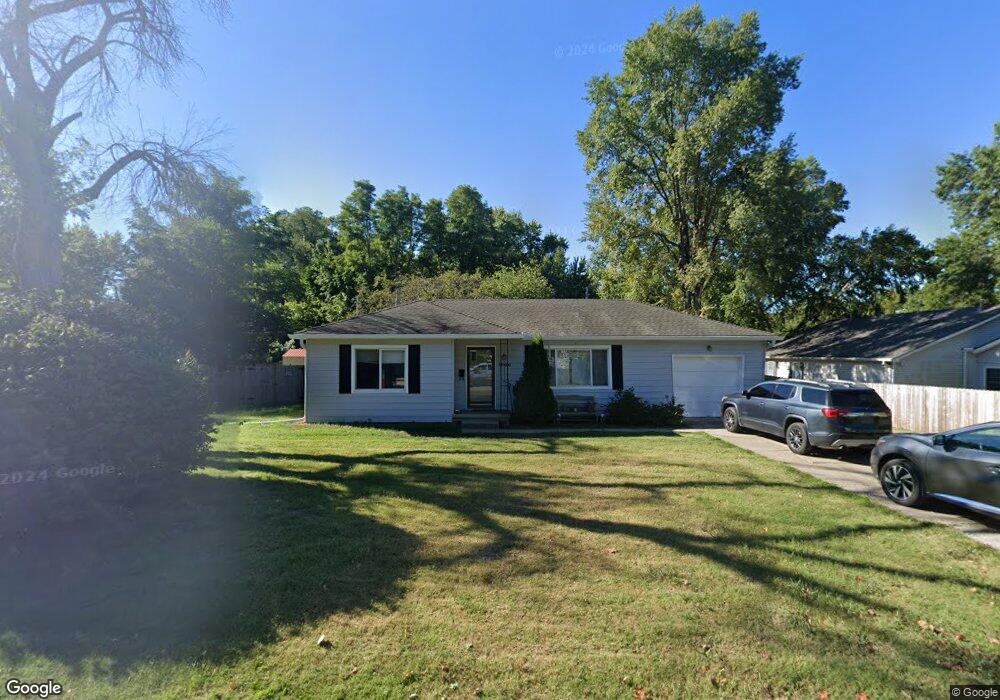
1506 NW A St Blue Springs, MO 64015
Estimated Value: $207,000 - $227,000
2
Beds
1
Bath
1,039
Sq Ft
$205/Sq Ft
Est. Value
About This Home
This home is located at 1506 NW A St, Blue Springs, MO 64015 and is currently estimated at $213,275, approximately $205 per square foot. 1506 NW A St is a home located in Jackson County with nearby schools including Thomas J. Ultican Elementary School, Paul Kinder Middle School, and Blue Springs High School.
Ownership History
Date
Name
Owned For
Owner Type
Purchase Details
Closed on
May 28, 2015
Sold by
Brower Sherri L and Brower Scott
Bought by
Bergstrom Curtis A and Bergstrom Debra
Current Estimated Value
Home Financials for this Owner
Home Financials are based on the most recent Mortgage that was taken out on this home.
Original Mortgage
$84,325
Outstanding Balance
$64,844
Interest Rate
3.71%
Mortgage Type
FHA
Estimated Equity
$148,431
Purchase Details
Closed on
Nov 22, 2010
Sold by
Shrout Larry R and Shrout Cynthia D
Bought by
Wilson Sherri L
Home Financials for this Owner
Home Financials are based on the most recent Mortgage that was taken out on this home.
Original Mortgage
$80,000
Interest Rate
6.5%
Mortgage Type
Seller Take Back
Purchase Details
Closed on
Feb 8, 2010
Sold by
New Resurrection Missionary Baptist Chur
Bought by
Victory In His Presence Ministries
Create a Home Valuation Report for This Property
The Home Valuation Report is an in-depth analysis detailing your home's value as well as a comparison with similar homes in the area
Home Values in the Area
Average Home Value in this Area
Purchase History
| Date | Buyer | Sale Price | Title Company |
|---|---|---|---|
| Bergstrom Curtis A | -- | None Available | |
| Wilson Sherri L | -- | First American Title | |
| Victory In His Presence Ministries | -- | Truhome Title Solutions |
Source: Public Records
Mortgage History
| Date | Status | Borrower | Loan Amount |
|---|---|---|---|
| Open | Bergstrom Curtis A | $84,325 | |
| Previous Owner | Wilson Sherri L | $80,000 |
Source: Public Records
Tax History Compared to Growth
Tax History
| Year | Tax Paid | Tax Assessment Tax Assessment Total Assessment is a certain percentage of the fair market value that is determined by local assessors to be the total taxable value of land and additions on the property. | Land | Improvement |
|---|---|---|---|---|
| 2025 | $2,076 | $29,270 | $7,017 | $22,253 |
| 2024 | $2,076 | $25,452 | $5,901 | $19,551 |
| 2023 | $2,037 | $25,452 | $3,355 | $22,097 |
| 2022 | $2,013 | $22,230 | $3,995 | $18,235 |
| 2021 | $2,011 | $22,230 | $3,995 | $18,235 |
| 2020 | $1,797 | $20,212 | $3,995 | $16,217 |
| 2019 | $1,738 | $20,212 | $3,995 | $16,217 |
| 2018 | $1,571 | $17,591 | $3,477 | $14,114 |
| 2017 | $1,571 | $17,591 | $3,477 | $14,114 |
| 2016 | $1,549 | $17,385 | $3,610 | $13,775 |
| 2014 | $1,383 | $15,468 | $3,718 | $11,750 |
Source: Public Records
Map
Nearby Homes
- 503 NW 15th St
- 305 NW 17th St
- 1109 NW B St
- 1705 SW Walnut St
- 2000 SW Smith St
- 804 NW North Summit Cir
- 1109 NW Mock Ave
- 401 SW 18th St
- 804 NW Maynard St
- 2317 NW Kensington Ct
- 318 SW 10th St
- 505 SW 18th St
- 510 SW 12 St
- 2508 NW Castle Dr
- 1700 SW Mc Arthur St
- 913 NW Camelot Ct
- 723 NW 6th Street Terrace
- 514 SW 10th St
- 216 SW 26th St
- 516 NW Mill Ct