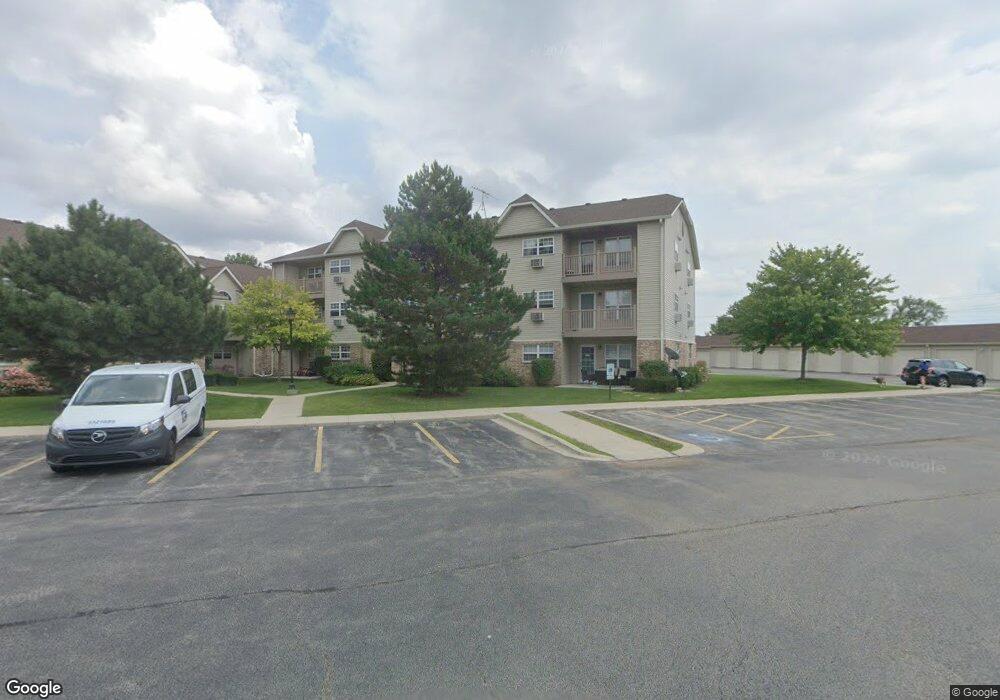
1506 Spring Brook Ct Unit 2F Round Lake Beach, IL 60073
Estimated Value: $124,000 - $161,000
1
Bed
1
Bath
668
Sq Ft
$204/Sq Ft
Est. Value
About This Home
This home is located at 1506 Spring Brook Ct Unit 2F, Round Lake Beach, IL 60073 and is currently estimated at $136,511, approximately $204 per square foot. 1506 Spring Brook Ct Unit 2F is a home located in Lake County with nearby schools including Indian Hill Elementary School, Round Lake Middle School, and Round Lake High School.
Ownership History
Date
Name
Owned For
Owner Type
Purchase Details
Closed on
Jun 9, 2006
Sold by
Michaels Michelle
Bought by
Dailey William
Current Estimated Value
Home Financials for this Owner
Home Financials are based on the most recent Mortgage that was taken out on this home.
Original Mortgage
$101,000
Outstanding Balance
$59,744
Interest Rate
6.68%
Mortgage Type
Unknown
Estimated Equity
$76,767
Purchase Details
Closed on
May 8, 2004
Sold by
Solem Earl W and Solem Elaine D
Bought by
Michaels Michelle
Home Financials for this Owner
Home Financials are based on the most recent Mortgage that was taken out on this home.
Original Mortgage
$86,800
Interest Rate
6.46%
Mortgage Type
FHA
Purchase Details
Closed on
Feb 23, 2001
Sold by
Midwest Bank & Trust Company
Bought by
Solem Earl W and Solem Elaine D
Create a Home Valuation Report for This Property
The Home Valuation Report is an in-depth analysis detailing your home's value as well as a comparison with similar homes in the area
Home Values in the Area
Average Home Value in this Area
Purchase History
| Date | Buyer | Sale Price | Title Company |
|---|---|---|---|
| Dailey William | $101,000 | Multiple | |
| Michaels Michelle | $89,500 | Chicago Title Insurance Comp | |
| Solem Earl W | $84,500 | -- |
Source: Public Records
Mortgage History
| Date | Status | Borrower | Loan Amount |
|---|---|---|---|
| Open | Dailey William | $101,000 | |
| Previous Owner | Michaels Michelle | $86,800 |
Source: Public Records
Tax History Compared to Growth
Tax History
| Year | Tax Paid | Tax Assessment Tax Assessment Total Assessment is a certain percentage of the fair market value that is determined by local assessors to be the total taxable value of land and additions on the property. | Land | Improvement |
|---|---|---|---|---|
| 2024 | $2,317 | $34,657 | $2,184 | $32,473 |
| 2023 | $2,223 | $31,807 | $2,004 | $29,803 |
| 2022 | $2,223 | $28,373 | $1,734 | $26,639 |
| 2021 | $2,170 | $25,583 | $1,801 | $23,782 |
| 2020 | $2,089 | $24,342 | $1,714 | $22,628 |
| 2019 | $2,015 | $23,354 | $1,644 | $21,710 |
| 2018 | $1,154 | $14,905 | $2,102 | $12,803 |
| 2017 | $1,118 | $14,020 | $1,977 | $12,043 |
| 2016 | $1,008 | $12,942 | $1,825 | $11,117 |
| 2015 | $913 | $11,823 | $1,667 | $10,156 |
| 2014 | $1,716 | $17,155 | $1 | $17,154 |
| 2012 | $1,769 | $17,916 | $1 | $17,915 |
Source: Public Records
Map
Nearby Homes
- 1443 Spring Brook Ct Unit 1C
- 1584 W Crystal Rock Ct Unit 2B
- 34661 N Gerberding Ave
- 1475 W Sedgewood Ct
- 1506 W Turtle Creek Ln
- 34763 Peterson Ave
- 1688 W Turtle Creek Ln
- 1561 W Turtle Creek Ln
- 1160 N Red Oak Cir Unit 1160-1
- 1221 N Village Dr
- 931 N Fairfield Rd
- 1256 N Split Oak Cir
- 347 N Red Oak Cir Unit 406
- 1316 N Red Oak Cir Unit 2
- 1543 W Remington Ln
- 1376 W Split Oak Cir
- 1248 N Red Oak Cir Unit 2
- 649 N Fox Trail
- 1110 N Fairfield Rd
- 915 Mayfield Dr
- 1506 Spring Brook Ct Unit 1F
- 1508 Spring Brook Ct Unit 3
- 1508 Spring Brook Ct Unit 3
- 1508 Spring Brook Ct Unit 3D
- 1508 Spring Brook Ct Unit 2D
- 1508 Spring Brook Ct Unit 1D
- 1508 Spring Brook Ct Unit 2C
- 1508 Spring Brook Ct Unit 1
- 1508 Spring Brook Ct Unit 2B
- 1508 Spring Brook Ct Unit CT15081
- 1508 Spring Brook Ct Unit 3
- 1508 Spring Brook Ct Unit 2A
- 1508 Spring Brook Ct Unit 1A
- 1506 Spring Brook Ct Unit CT15062
- 1506 Spring Brook Ct Unit CT15061
- 1506 Spring Brook Ct Unit CT15062
- 1506 Spring Brook Ct Unit CT15061
- 1506 Spring Brook Ct Unit CT15062
- 1506 Spring Brook Ct Unit 1
- 1506 Spring Brook Ct Unit 1G