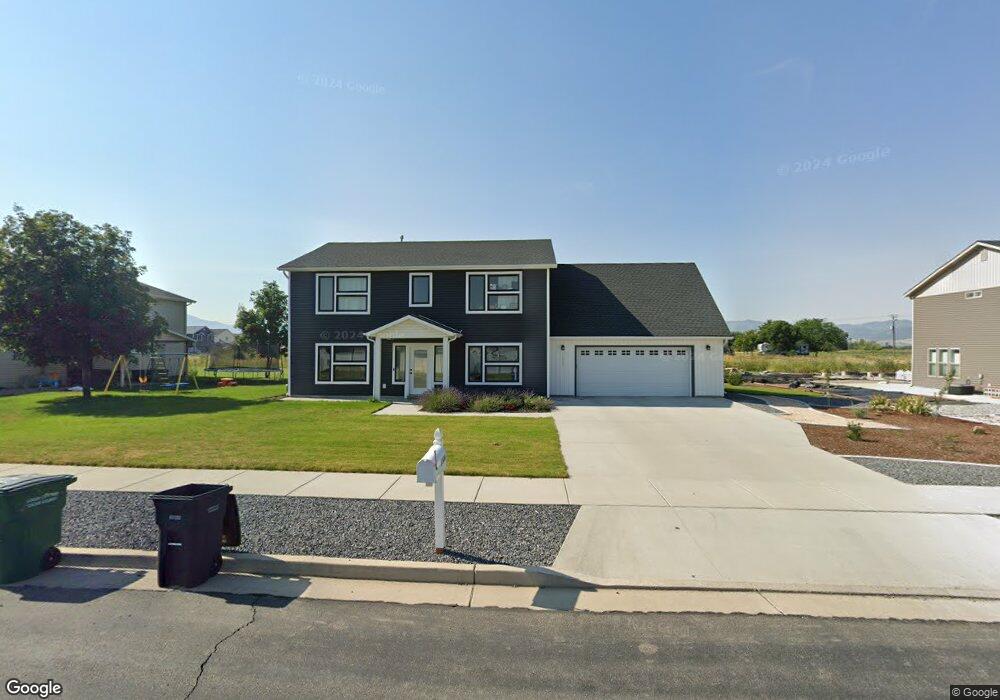
1506 W 3350 S Nibley, UT 84321
Estimated Value: $531,000 - $552,550
4
Beds
3
Baths
2,680
Sq Ft
$203/Sq Ft
Est. Value
About This Home
This home is located at 1506 W 3350 S, Nibley, UT 84321 and is currently estimated at $542,888, approximately $202 per square foot. 1506 W 3350 S is a home located in Cache County with nearby schools including Heritage School, South Cache Middle School, and Spring Creek Middle School.
Ownership History
Date
Name
Owned For
Owner Type
Purchase Details
Closed on
Mar 30, 2018
Sold by
Cache Valley General Contractors
Bought by
Chambers Scott T and Chambers Haley N
Current Estimated Value
Home Financials for this Owner
Home Financials are based on the most recent Mortgage that was taken out on this home.
Original Mortgage
$273,051
Outstanding Balance
$233,919
Interest Rate
4.46%
Mortgage Type
New Conventional
Estimated Equity
$308,969
Purchase Details
Closed on
Dec 5, 2016
Sold by
Foxborrough Estates Llc
Bought by
Cache Valley General Contractors
Home Financials for this Owner
Home Financials are based on the most recent Mortgage that was taken out on this home.
Original Mortgage
$170,000
Interest Rate
3.54%
Mortgage Type
Commercial
Create a Home Valuation Report for This Property
The Home Valuation Report is an in-depth analysis detailing your home's value as well as a comparison with similar homes in the area
Home Values in the Area
Average Home Value in this Area
Purchase History
| Date | Buyer | Sale Price | Title Company |
|---|---|---|---|
| Chambers Scott T | -- | Pinnacle Title | |
| Cache Valley General Contractors | -- | Pinnacle Title |
Source: Public Records
Mortgage History
| Date | Status | Borrower | Loan Amount |
|---|---|---|---|
| Open | Chambers Scott T | $273,051 | |
| Previous Owner | Cache Valley General Contractors | $170,000 |
Source: Public Records
Tax History Compared to Growth
Tax History
| Year | Tax Paid | Tax Assessment Tax Assessment Total Assessment is a certain percentage of the fair market value that is determined by local assessors to be the total taxable value of land and additions on the property. | Land | Improvement |
|---|---|---|---|---|
| 2025 | $2,190 | $290,315 | $0 | $0 |
| 2024 | $2,321 | $288,910 | $0 | $0 |
| 2023 | $2,462 | $286,855 | $0 | $0 |
| 2022 | $2,562 | $286,855 | $0 | $0 |
| 2021 | $1,866 | $324,515 | $65,650 | $258,865 |
| 2020 | $1,757 | $290,750 | $65,650 | $225,100 |
| 2019 | $1,842 | $290,750 | $65,650 | $225,100 |
| 2018 | $1,389 | $213,800 | $55,200 | $158,600 |
| 2017 | $474 | $38,640 | $0 | $0 |
| 2016 | $479 | $38,640 | $0 | $0 |
Source: Public Records
Map
Nearby Homes
- 1502 W 3350 S
- 3361 S 1500 W
- 1522 W 3350 S Unit 47
- 1522 W 3350 S
- 1511 W 3350 S Unit 49
- 1511 W 3350 S
- 1536 W 3350 S Unit 46
- 3339 S 1500 W
- 3364 S 1500 W
- 3337 S 1525 W
- 1537 W 3350 S Unit 41
- 3382 S 1500 W
- 3323 S 1500 W
- 1552 W 3350 S Unit 45
- 1552 W 3350 S
- 3328 S 1525 W
- 3336 S 1500 W
- 3400 S 1500 W
- 3329 S 1525 W
- 3365 S 1460 W