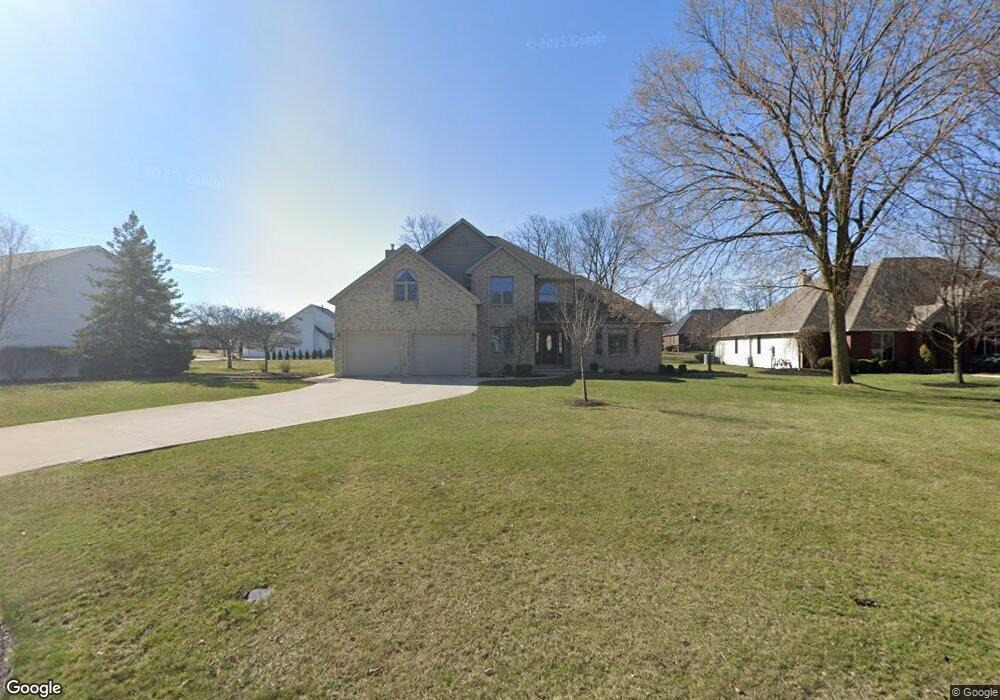
1507 Cypress Lake Findlay, OH 45840
Estimated Value: $445,000 - $483,025
3
Beds
4
Baths
2,084
Sq Ft
$221/Sq Ft
Est. Value
About This Home
This home is located at 1507 Cypress Lake, Findlay, OH 45840 and is currently estimated at $461,506, approximately $221 per square foot. 1507 Cypress Lake is a home located in Hancock County with nearby schools including Liberty-Benton Elementary School, Liberty-Benton Middle School, and Liberty-Benton High School.
Ownership History
Date
Name
Owned For
Owner Type
Purchase Details
Closed on
Jun 17, 2002
Sold by
Relocation Properties Mg
Bought by
Gonda John A and Gonda Stacey R
Current Estimated Value
Home Financials for this Owner
Home Financials are based on the most recent Mortgage that was taken out on this home.
Original Mortgage
$250,000
Outstanding Balance
$111,235
Interest Rate
6.87%
Mortgage Type
New Conventional
Estimated Equity
$345,242
Purchase Details
Closed on
Nov 20, 2001
Sold by
Garza Noel R
Bought by
Relocation Properties Managment Llc
Purchase Details
Closed on
Dec 15, 1999
Sold by
Wicks Const Co
Bought by
Garza Noel R and Garza Lucinda A
Home Financials for this Owner
Home Financials are based on the most recent Mortgage that was taken out on this home.
Original Mortgage
$200,000
Interest Rate
6.63%
Mortgage Type
New Conventional
Purchase Details
Closed on
Jan 14, 1993
Bought by
Meyer Russell J and Meyer Lisa A
Purchase Details
Closed on
Jul 16, 1992
Bought by
Findlay Hillcrest Golf Crs
Create a Home Valuation Report for This Property
The Home Valuation Report is an in-depth analysis detailing your home's value as well as a comparison with similar homes in the area
Home Values in the Area
Average Home Value in this Area
Purchase History
| Date | Buyer | Sale Price | Title Company |
|---|---|---|---|
| Gonda John A | $316,000 | -- | |
| Relocation Properties Managment Llc | $326,000 | -- | |
| Garza Noel R | $270,000 | -- | |
| Meyer Russell J | $29,500 | -- | |
| Findlay Hillcrest Golf Crs | -- | -- |
Source: Public Records
Mortgage History
| Date | Status | Borrower | Loan Amount |
|---|---|---|---|
| Open | Gonda John A | $250,000 | |
| Previous Owner | Garza Noel R | $200,000 |
Source: Public Records
Tax History Compared to Growth
Tax History
| Year | Tax Paid | Tax Assessment Tax Assessment Total Assessment is a certain percentage of the fair market value that is determined by local assessors to be the total taxable value of land and additions on the property. | Land | Improvement |
|---|---|---|---|---|
| 2024 | $5,276 | $141,930 | $22,110 | $119,820 |
| 2023 | $5,152 | $141,930 | $22,110 | $119,820 |
| 2022 | $5,101 | $141,930 | $22,110 | $119,820 |
| 2021 | $4,754 | $116,760 | $22,150 | $94,610 |
| 2020 | $4,795 | $116,760 | $22,150 | $94,610 |
| 2019 | $4,583 | $116,330 | $22,150 | $94,180 |
| 2018 | $3,926 | $110,000 | $15,820 | $94,180 |
| 2017 | $4,050 | $110,000 | $15,820 | $94,180 |
| 2016 | $3,923 | $110,000 | $15,820 | $94,180 |
| 2015 | $3,017 | $82,400 | $16,690 | $65,710 |
| 2014 | $3,045 | $82,400 | $16,690 | $65,710 |
| 2012 | $3,400 | $88,110 | $16,690 | $71,420 |
Source: Public Records
Map
Nearby Homes
- 1405 Cypress Lake
- 1801 Lakeland Dr
- 1616 Firestone Dr
- 6535 Silver Lake Dr
- 3219 Gleneagle Dr
- 1133 Inverness Dr
- 0 Glenmar Pkwy
- 0 County Road 95 Unit 6097574
- 3815 Forest Trail Dr
- 3835 Forest Trail Dr
- 1604 White Tail Run
- 933 Laurel Ln
- 0 Bushwillow Dr Or Rock Candy Rd Unit 206795
- 0 Rock Candy Rd Or Bushwillow Dr Unit 206820
- 0 Rock Candy Rd Unit Lot 172 206819
- 0 Rock Candy Rd
- 0 Bearcat Way Or Rock Candy Rd Unit 206810
- 0 Allen Township 142
- 905 W Melrose Ave
- 3320 Crosshill Dr
- 1501 Cypress Lake
- 1515 Cypress Lake
- 3006 Turnberry Dr
- 1600 Pinehurst Dr
- 2957 Spyglass Dr
- 1607 Cypress Lake
- 1516 Cypress Lake
- 3000 Turnberry Dr
- 1508 Cypress Lake
- 1423 Cypress Lake
- 1500 Cypress Lake
- 1600 Cypress Lake
- 1604 Pinehurst Dr
- 1615 Cypress Lake
- 2949 Spyglass Dr
- 1424 Brook Lawn
- 2942 Turnberry Dr
- 1418 Cypress Lake
- 1419 Cypress Lake
- 1608 Cypress Lake