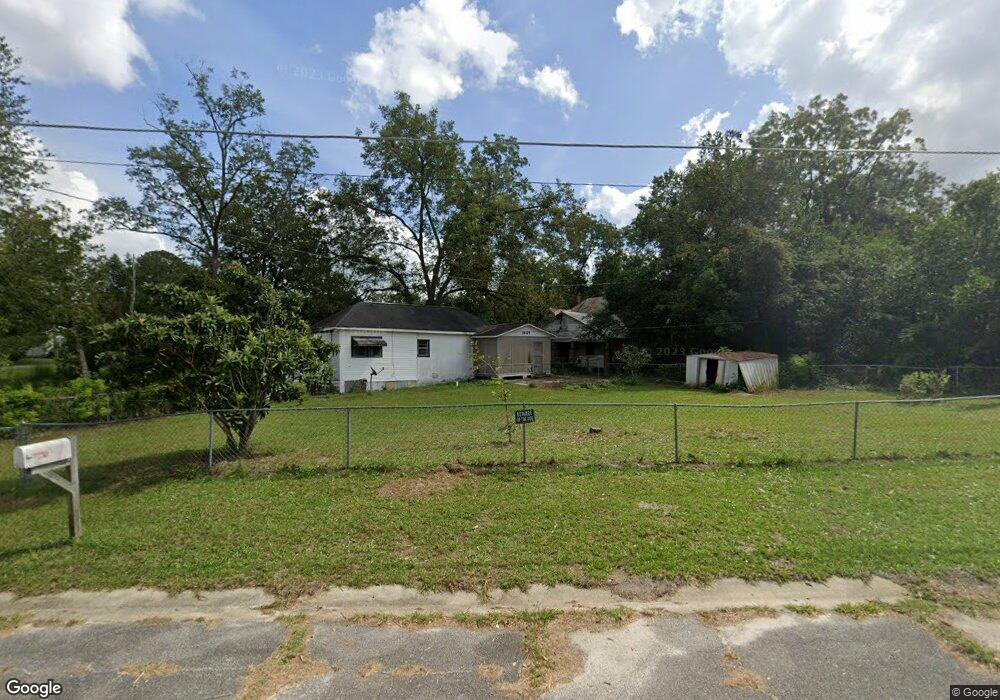
1507 Lee Ave Waycross, GA 31503
Estimated Value: $50,000 - $75,427
2
Beds
1
Bath
1,139
Sq Ft
$58/Sq Ft
Est. Value
About This Home
This home is located at 1507 Lee Ave, Waycross, GA 31503 and is currently estimated at $65,857, approximately $57 per square foot. 1507 Lee Ave is a home located in Ware County with nearby schools including Ruskin Elementary School, Ware County Middle School, and Ware County High School.
Ownership History
Date
Name
Owned For
Owner Type
Purchase Details
Closed on
Oct 14, 2019
Sold by
Alonso Cynthia Sue
Bought by
Williams Kathy and Williams David
Current Estimated Value
Purchase Details
Closed on
Nov 2, 2015
Sold by
R J Welch & Son Inc
Bought by
Alonso Felix Bernandez and Alonso Cynthia Sue
Purchase Details
Closed on
Sep 19, 2000
Sold by
City Of Waycross
Bought by
Welch R J & Sons Inc
Purchase Details
Closed on
Jun 18, 2000
Sold by
1St Franklin Fin Corp
Bought by
Welch R J & Sons Inc
Purchase Details
Closed on
Sep 1, 1998
Sold by
Baptiste Feries and Baptiste Ki
Bought by
1St Franklin Fin Corp
Purchase Details
Closed on
Apr 2, 1998
Sold by
Welch R J & Son Inc
Bought by
Baptiste Feries and Baptiste Ki
Purchase Details
Closed on
Aug 31, 1992
Sold by
Welch R J & Son Inc
Bought by
Welch R J & Son Inc
Purchase Details
Closed on
Feb 20, 1991
Bought by
Welch R J & Son Inc
Create a Home Valuation Report for This Property
The Home Valuation Report is an in-depth analysis detailing your home's value as well as a comparison with similar homes in the area
Home Values in the Area
Average Home Value in this Area
Purchase History
| Date | Buyer | Sale Price | Title Company |
|---|---|---|---|
| Williams Kathy | $5,000 | -- | |
| Alonso Felix Bernandez | $28,000 | -- | |
| Welch R J & Sons Inc | -- | -- | |
| Welch R J & Sons Inc | $14,000 | -- | |
| 1St Franklin Fin Corp | $20,000 | -- | |
| Baptiste Feries | $20,500 | -- | |
| Welch R J & Son Inc | $3,500 | -- | |
| Welch R J & Son Inc | -- | -- |
Source: Public Records
Tax History Compared to Growth
Tax History
| Year | Tax Paid | Tax Assessment Tax Assessment Total Assessment is a certain percentage of the fair market value that is determined by local assessors to be the total taxable value of land and additions on the property. | Land | Improvement |
|---|---|---|---|---|
| 2024 | $257 | $16,944 | $3,280 | $13,664 |
| 2023 | $584 | $13,764 | $1,835 | $11,929 |
| 2022 | $549 | $13,764 | $1,835 | $11,929 |
| 2021 | $434 | $10,029 | $1,835 | $8,194 |
| 2020 | $87 | $9,892 | $1,835 | $8,057 |
| 2019 | $228 | $9,341 | $1,835 | $7,506 |
| 2018 | $230 | $8,997 | $1,835 | $7,162 |
| 2017 | $223 | $8,997 | $1,835 | $7,162 |
| 2016 | $223 | $8,997 | $1,835 | $7,162 |
| 2015 | $224 | $8,996 | $1,835 | $7,162 |
| 2014 | $224 | $8,996 | $1,835 | $7,162 |
| 2013 | -- | $8,996 | $1,834 | $7,161 |
Source: Public Records
Map
Nearby Homes
- 1304 Brunel St
- 1021 Lee Ave
- 201 Washington Ave
- 1808 Brunel St
- 0 Cabinet St
- 805 Brunel St
- 615 Morton Ave
- 705 Gilmore St
- 306 Lee Ave
- 418 Reed St
- 2204 & 2210 Gibbs St
- 1103 Ann St
- 0 Marion St
- 1500 Georgia Ave
- 803 Elizabeth St
- 1125 Georgia St
- 0 Kentucky Ave
- 1208 Margaret St
- 924 Highsmith St
- 506 McDonald St