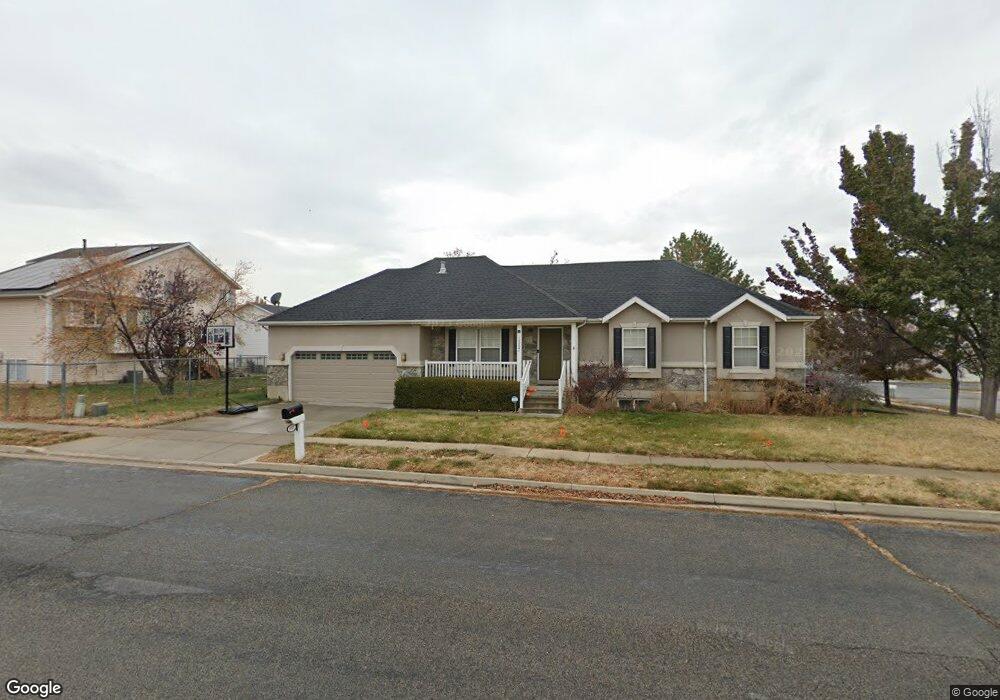
1507 N 780 W Clearfield, UT 84015
Estimated Value: $449,000 - $472,000
2
Beds
2
Baths
2,340
Sq Ft
$196/Sq Ft
Est. Value
About This Home
This home is located at 1507 N 780 W, Clearfield, UT 84015 and is currently estimated at $459,646, approximately $196 per square foot. 1507 N 780 W is a home located in Davis County with nearby schools including Clinton Elementary School, Sunset Junior High School, and Clearfield High School.
Ownership History
Date
Name
Owned For
Owner Type
Purchase Details
Closed on
Sep 21, 2017
Sold by
Coleman Mark
Bought by
Rhees Jeremy S and Rhees Jacee L
Current Estimated Value
Purchase Details
Closed on
Oct 8, 1999
Sold by
Coleman Mark E and Coleman Kim M
Bought by
Coleman Mark E
Home Financials for this Owner
Home Financials are based on the most recent Mortgage that was taken out on this home.
Original Mortgage
$131,400
Interest Rate
7.87%
Purchase Details
Closed on
Apr 30, 1998
Sold by
Mark Higley Construction Lc
Bought by
Coleman Mark E and Coleman Kim M
Home Financials for this Owner
Home Financials are based on the most recent Mortgage that was taken out on this home.
Original Mortgage
$131,300
Interest Rate
7.06%
Create a Home Valuation Report for This Property
The Home Valuation Report is an in-depth analysis detailing your home's value as well as a comparison with similar homes in the area
Home Values in the Area
Average Home Value in this Area
Purchase History
| Date | Buyer | Sale Price | Title Company |
|---|---|---|---|
| Rhees Jeremy S | -- | -- | |
| Coleman Mark E | -- | United Title Services | |
| Coleman Mark E | -- | First American Title Co |
Source: Public Records
Mortgage History
| Date | Status | Borrower | Loan Amount |
|---|---|---|---|
| Previous Owner | Coleman Mark E | $131,400 | |
| Previous Owner | Coleman Mark E | $131,300 |
Source: Public Records
Tax History Compared to Growth
Tax History
| Year | Tax Paid | Tax Assessment Tax Assessment Total Assessment is a certain percentage of the fair market value that is determined by local assessors to be the total taxable value of land and additions on the property. | Land | Improvement |
|---|---|---|---|---|
| 2025 | $2,391 | $229,900 | $88,773 | $141,127 |
| 2024 | $2,293 | $221,650 | $97,742 | $123,908 |
| 2023 | $2,287 | $409,000 | $110,923 | $298,077 |
| 2022 | $2,418 | $239,250 | $68,201 | $171,049 |
| 2021 | $2,167 | $318,000 | $84,789 | $233,211 |
| 2020 | $1,880 | $273,000 | $71,735 | $201,265 |
| 2019 | $1,811 | $257,000 | $84,406 | $172,594 |
| 2018 | $1,707 | $238,000 | $71,368 | $166,632 |
| 2016 | $1,554 | $111,870 | $27,726 | $84,144 |
| 2015 | $1,568 | $107,305 | $27,726 | $79,579 |
| 2014 | $1,474 | $102,455 | $27,726 | $74,729 |
| 2013 | -- | $99,987 | $27,143 | $72,844 |
Source: Public Records
Map
Nearby Homes