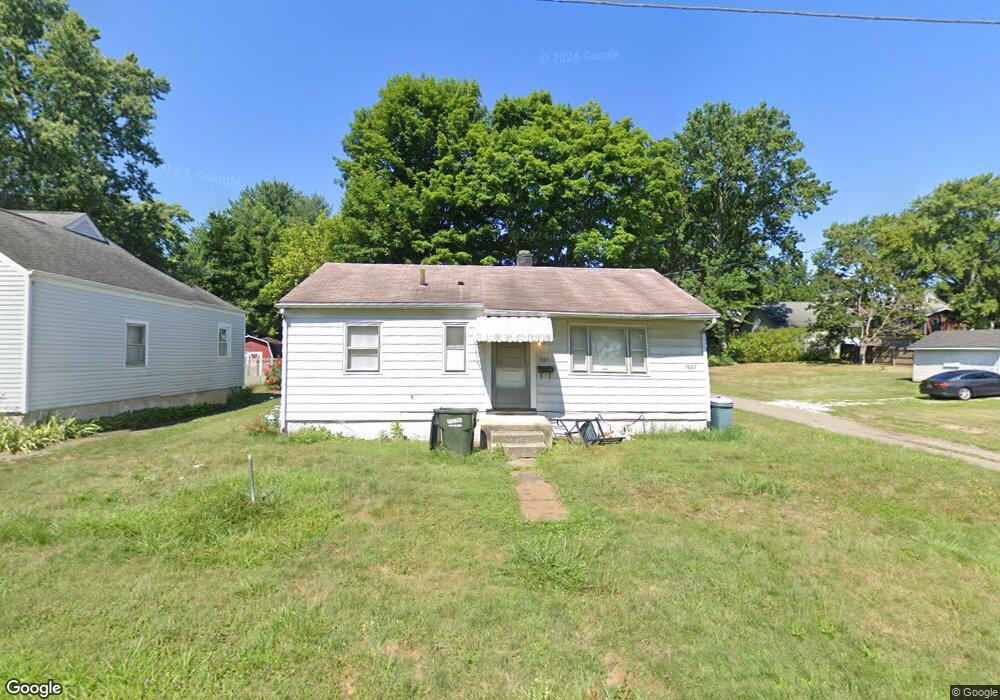
1507 S Freedom Ave Alliance, OH 44601
Estimated Value: $55,000 - $69,174
3
Beds
1
Bath
816
Sq Ft
$78/Sq Ft
Est. Value
About This Home
This home is located at 1507 S Freedom Ave, Alliance, OH 44601 and is currently estimated at $63,294, approximately $77 per square foot. 1507 S Freedom Ave is a home located in Stark County with nearby schools including Alliance Elementary School at Rockhill, Alliance Intermediate School at Northside, and Alliance Middle School.
Ownership History
Date
Name
Owned For
Owner Type
Purchase Details
Closed on
Mar 7, 2022
Sold by
Unicorn Development
Bought by
Guardian Fund Llc
Current Estimated Value
Purchase Details
Closed on
Jan 29, 2020
Sold by
Guardian Fund Llc
Bought by
Unicorn Development Llc
Purchase Details
Closed on
Nov 26, 2019
Sold by
Edwards Cody
Bought by
Guardian Fund Llc
Purchase Details
Closed on
Jun 14, 2017
Sold by
Steed Family Properties Llc
Bought by
Home Partners Llc
Purchase Details
Closed on
Jun 7, 2017
Sold by
Buehler Lawrence J
Bought by
Steed Family Properties Llc
Purchase Details
Closed on
Sep 2, 2005
Sold by
Westview Properties Llc
Bought by
Buehler Lawrence J
Purchase Details
Closed on
Jul 29, 2005
Sold by
Harrell Merriam H
Bought by
Westview Properties Llc
Create a Home Valuation Report for This Property
The Home Valuation Report is an in-depth analysis detailing your home's value as well as a comparison with similar homes in the area
Home Values in the Area
Average Home Value in this Area
Purchase History
| Date | Buyer | Sale Price | Title Company |
|---|---|---|---|
| Guardian Fund Llc | $38,200 | None Listed On Document | |
| Unicorn Development Llc | $40,000 | None Available | |
| Guardian Fund Llc | $32,600 | None Available | |
| Home Partners Llc | $18,000 | None Available | |
| Steed Family Properties Llc | $12,000 | None Available | |
| Buehler Lawrence J | -- | -- | |
| Westview Properties Llc | $35,000 | -- |
Source: Public Records
Tax History Compared to Growth
Tax History
| Year | Tax Paid | Tax Assessment Tax Assessment Total Assessment is a certain percentage of the fair market value that is determined by local assessors to be the total taxable value of land and additions on the property. | Land | Improvement |
|---|---|---|---|---|
| 2025 | -- | $12,150 | $10,080 | $2,070 |
| 2024 | $13 | $12,150 | $10,080 | $2,070 |
| 2023 | $797 | $12,260 | $7,950 | $4,310 |
| 2022 | $508 | $12,260 | $7,950 | $4,310 |
| 2021 | $509 | $12,260 | $7,950 | $4,310 |
| 2020 | $471 | $10,580 | $6,900 | $3,680 |
| 2019 | $464 | $10,580 | $6,900 | $3,680 |
| 2018 | $466 | $10,580 | $6,900 | $3,680 |
| 2017 | $432 | $9,630 | $6,580 | $3,050 |
| 2016 | $445 | $9,840 | $6,580 | $3,260 |
| 2015 | $569 | $12,460 | $6,580 | $5,880 |
| 2014 | $497 | $10,360 | $5,460 | $4,900 |
| 2013 | $248 | $10,360 | $5,460 | $4,900 |
Source: Public Records
Map
Nearby Homes
- 1437 S Linden Ave
- 551 South St
- 390 E College St
- 729 Waugh St
- 815 Grace St
- 1395 S Webb Ave
- 1475 Chatauqua Ct
- 1846 S Freedom Ave
- 112 E College St
- 1005 S Freedom Ave
- 1044 S Liberty Ave
- 317 E State St
- 1233 Woodland Ave
- 814 Milner St
- 2218 S Freedom Ave
- 831 Wade Ave
- 452 E Summit St
- 807 S Union Ave
- 2376 S Seneca Ave
- 2408 S Linden Ave
- 1517 S Freedom Ave
- 1471 S Freedom Ave
- 1461 S Freedom Ave
- 1508 S Freedom Ave
- 1508 S Linden Ave
- 1520 S Linden Ave
- 1476 S Linden Ave
- 1510 S Linden Ave
- 1480 S Freedom Ave
- 1466 S Linden Ave
- 1472 S Freedom Ave
- 1445 S Freedom Ave
- 1536 S Freedom Ave
- 1462 S Freedom Ave
- 1557 S Freedom Ave
- 1458 S Freedom Ave
- 1435 S Freedom Ave
- 1456 S Freedom Ave
- 1446 S Linden Ave
- 1444 S Freedom Ave