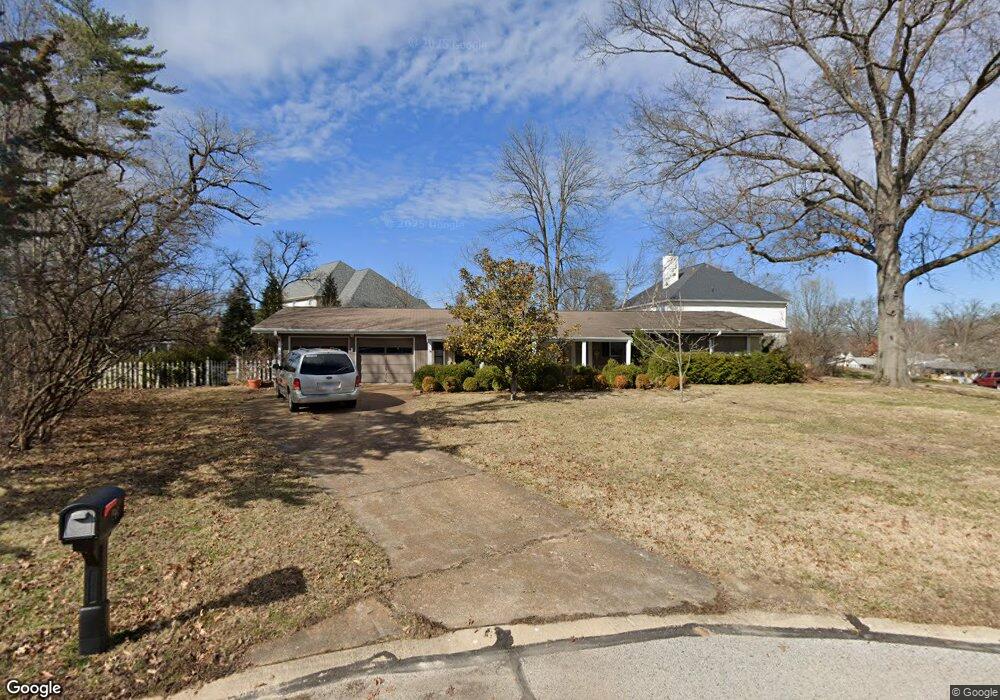
1507 Windridge Dr Saint Louis, MO 63131
Estimated Value: $498,032 - $639,000
3
Beds
2
Baths
1,728
Sq Ft
$322/Sq Ft
Est. Value
About This Home
This home is located at 1507 Windridge Dr, Saint Louis, MO 63131 and is currently estimated at $556,008, approximately $321 per square foot. 1507 Windridge Dr is a home located in St. Louis County with nearby schools including Westchester Elementary School, North Kirkwood Middle School, and Kirkwood Senior High School.
Ownership History
Date
Name
Owned For
Owner Type
Purchase Details
Closed on
Jun 11, 2001
Sold by
Unlimited Holdings Co
Bought by
Whitney John E and Whitney Carol L
Current Estimated Value
Home Financials for this Owner
Home Financials are based on the most recent Mortgage that was taken out on this home.
Original Mortgage
$156,750
Outstanding Balance
$59,535
Interest Rate
7.1%
Estimated Equity
$496,473
Purchase Details
Closed on
Jul 21, 1997
Sold by
Ridgemoor Properties Inc
Bought by
Unlimited Holdings Inc
Home Financials for this Owner
Home Financials are based on the most recent Mortgage that was taken out on this home.
Original Mortgage
$107,500
Interest Rate
7.94%
Purchase Details
Closed on
Jun 30, 1997
Sold by
Cindy Lazzari
Bought by
Ridgemoor Properties Inc
Home Financials for this Owner
Home Financials are based on the most recent Mortgage that was taken out on this home.
Original Mortgage
$107,500
Interest Rate
7.94%
Create a Home Valuation Report for This Property
The Home Valuation Report is an in-depth analysis detailing your home's value as well as a comparison with similar homes in the area
Home Values in the Area
Average Home Value in this Area
Purchase History
| Date | Buyer | Sale Price | Title Company |
|---|---|---|---|
| Whitney John E | $165,000 | -- | |
| Whitney John E | $165,000 | -- | |
| Unlimited Holdings Inc | -- | -- | |
| Ridgemoor Properties Inc | -- | -- |
Source: Public Records
Mortgage History
| Date | Status | Borrower | Loan Amount |
|---|---|---|---|
| Open | Whitney John E | $156,750 | |
| Closed | Whitney John E | $156,750 | |
| Previous Owner | Ridgemoor Properties Inc | $107,500 |
Source: Public Records
Tax History Compared to Growth
Tax History
| Year | Tax Paid | Tax Assessment Tax Assessment Total Assessment is a certain percentage of the fair market value that is determined by local assessors to be the total taxable value of land and additions on the property. | Land | Improvement |
|---|---|---|---|---|
| 2025 | $4,115 | $83,220 | $73,740 | $9,480 |
| 2024 | $4,115 | $70,970 | $58,580 | $12,390 |
| 2023 | $4,051 | $70,970 | $58,580 | $12,390 |
| 2022 | $3,964 | $64,720 | $58,580 | $6,140 |
| 2021 | $3,922 | $64,720 | $58,580 | $6,140 |
| 2020 | $4,056 | $64,370 | $54,070 | $10,300 |
| 2019 | $4,061 | $64,370 | $54,070 | $10,300 |
| 2018 | $3,059 | $43,420 | $27,800 | $15,620 |
| 2017 | $3,068 | $43,420 | $27,800 | $15,620 |
| 2016 | $2,573 | $36,830 | $24,000 | $12,830 |
| 2015 | $2,576 | $36,830 | $24,000 | $12,830 |
| 2014 | $2,315 | $32,300 | $12,120 | $20,180 |
Source: Public Records
Map
Nearby Homes
- 8 Briarbrook Trail
- 723 Oak Valley Dr
- 1728 Folkstone Dr
- 1126 Bopp Rd
- 1345 Woodgate Dr
- 1741 Pine Hill Dr
- 811 Cherry St
- 1090 Kinstern Dr
- 1029 Kinstern Dr
- 11909 Lillian Ave
- 11913 Lillian Ave
- 12439 Springdale Ln Unit TBB
- 12006 Montour Dr
- The Hawthorne Plan at Ballas Ridge
- The Roclare II Plan at Ballas Ridge
- The Westchester IV Plan at Ballas Ridge
- The Nottingham II Plan at Ballas Ridge
- The Hawthorne II Plan at Ballas Ridge
- 11358 Manchester Rd
- TBB
- 1525 Windridge Ct
- 1501 Windridge Dr
- 1533 Windridge Ct
- 1500 Windridge Dr
- 1506 Windridge Dr
- 1520 Windridge Dr
- 1512 Windridge Dr
- 1528 Windridge Dr
- 1537 Windridge Ct
- 1547 Windridge Ct
- 1536 Windridge Dr
- 11901 Kendon Dr
- 1543 Windridge Ct
- 11907 Kendon Dr
- 11915 Kendon Dr
- 1527 Fawnvalley Dr
- 1535 Fawnvalley Dr
- 1555 Windridge Dr
- 1544 Windridge Dr
- 1543 Fawnvalley Dr