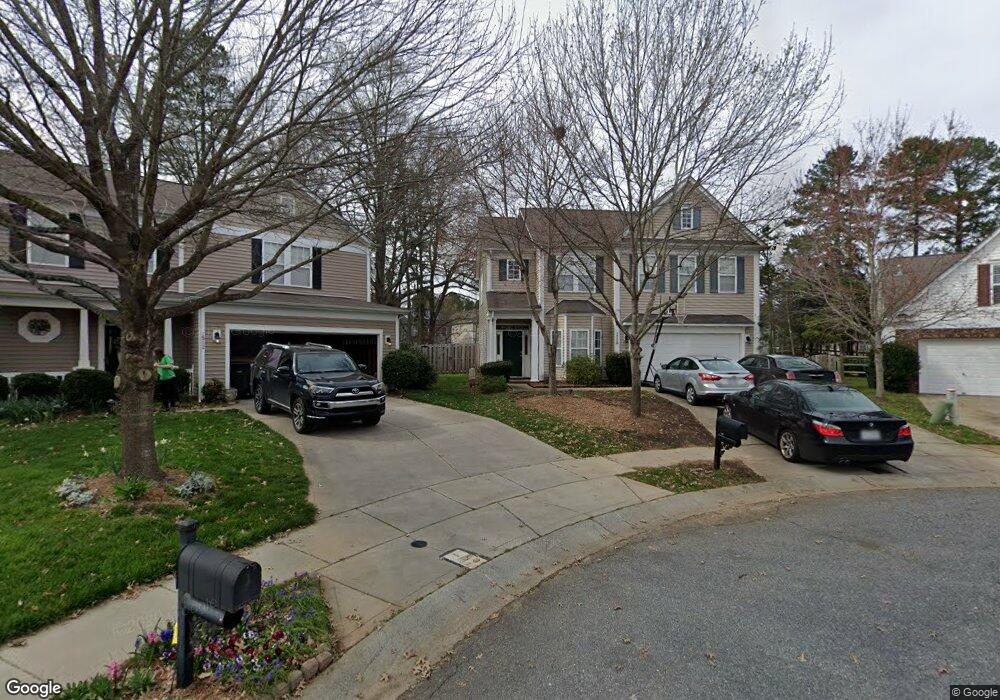
1508 Bucklebury Ct Charlotte, NC 28269
Estimated Value: $412,000 - $445,000
3
Beds
3
Baths
1,969
Sq Ft
$220/Sq Ft
Est. Value
About This Home
This home is located at 1508 Bucklebury Ct, Charlotte, NC 28269 and is currently estimated at $432,806, approximately $219 per square foot. 1508 Bucklebury Ct is a home located in Cabarrus County with nearby schools including Cox Mill Elementary School, Harold E. Winkler Middle School, and Cox Mill High School.
Ownership History
Date
Name
Owned For
Owner Type
Purchase Details
Closed on
Apr 26, 2011
Sold by
Blair Mickey Charles and Blair Trivonna June
Bought by
Chapman Patricia A
Current Estimated Value
Home Financials for this Owner
Home Financials are based on the most recent Mortgage that was taken out on this home.
Original Mortgage
$170,000
Outstanding Balance
$117,377
Interest Rate
4.74%
Mortgage Type
New Conventional
Estimated Equity
$315,429
Purchase Details
Closed on
Jul 15, 2004
Sold by
Mulvaney Homes Inc
Bought by
Blair Mickey Charles and Blair Trivonna June
Home Financials for this Owner
Home Financials are based on the most recent Mortgage that was taken out on this home.
Original Mortgage
$141,300
Interest Rate
3.75%
Mortgage Type
Purchase Money Mortgage
Purchase Details
Closed on
Feb 9, 2004
Sold by
Rhein Highland Creek Llc
Bought by
Mulvaney Homes Inc
Create a Home Valuation Report for This Property
The Home Valuation Report is an in-depth analysis detailing your home's value as well as a comparison with similar homes in the area
Home Values in the Area
Average Home Value in this Area
Purchase History
| Date | Buyer | Sale Price | Title Company |
|---|---|---|---|
| Chapman Patricia A | $170,000 | None Available | |
| Blair Mickey Charles | $183,500 | First American Title Ins Co | |
| Mulvaney Homes Inc | $109,500 | -- |
Source: Public Records
Mortgage History
| Date | Status | Borrower | Loan Amount |
|---|---|---|---|
| Open | Chapman Patricia A | $170,000 | |
| Closed | Chapman Patricia A | $170,000 | |
| Previous Owner | Blair Mickey Charles | $141,300 |
Source: Public Records
Tax History Compared to Growth
Tax History
| Year | Tax Paid | Tax Assessment Tax Assessment Total Assessment is a certain percentage of the fair market value that is determined by local assessors to be the total taxable value of land and additions on the property. | Land | Improvement |
|---|---|---|---|---|
| 2025 | $3,813 | $382,870 | $73,000 | $309,870 |
| 2024 | $3,813 | $382,870 | $73,000 | $309,870 |
| 2023 | $2,738 | $224,440 | $52,000 | $172,440 |
| 2022 | $2,738 | $224,440 | $52,000 | $172,440 |
| 2021 | $2,738 | $224,440 | $52,000 | $172,440 |
| 2020 | $2,738 | $224,440 | $52,000 | $172,440 |
| 2019 | $2,217 | $181,690 | $37,000 | $144,690 |
| 2018 | $2,180 | $181,690 | $37,000 | $144,690 |
| 2017 | $2,144 | $181,690 | $37,000 | $144,690 |
| 2016 | $1,272 | $166,230 | $27,000 | $139,230 |
| 2015 | $1,962 | $166,230 | $27,000 | $139,230 |
| 2014 | $1,962 | $166,230 | $27,000 | $139,230 |
Source: Public Records
Map
Nearby Homes
- 1523 Callender Ln
- 10056 Paisley Dr
- 1960 Wilburn Park Ln NW
- 1930 Wilburn Park Ln NW
- 9529 Numenore Dr
- 1458 Bedlington Dr NW
- 10341 Montrose Dr NW
- 1432 Bedlington Dr NW
- 2055 Solway Ln
- 10004 Legolas Ln
- 10015 Legolas Ln
- 2013 Solway Ln
- 1309 Bedlington Dr NW
- 2111 Elendil Ln
- 2506 Susie Brumley Place NW
- 966 Parkland Place NW
- 9516 Pacing Ln NW
- 10166 Falling Leaf Dr NW
- 8408 Brookings Dr
- 9509 Pacing Ln NW
- 1512 Bucklebury Ct
- 1504 Bucklebury Ct
- 1511 Callender Ln
- 1515 Callender Ln
- 9612 Waltham Ct
- 1507 Callender Ln
- 1519 Callender Ln
- 9616 Waltham Ct
- 1505 Bucklebury Ct
- 1503 Callender Ln
- 1520 Bucklebury Ct
- 9622 Waltham Ct
- 1527 Callender Ln
- 1509 Bucklebury Ct
- 1524 Bucklebury Ct
- 1513 Bucklebury Ct
- 9634 Waltham Ct
- 1517 Bucklebury Ct
- 1525 Bucklebury Ct
- 1521 Bucklebury Ct