Estimated Value: $509,756 - $542,000
3
Beds
2
Baths
999
Sq Ft
$522/Sq Ft
Est. Value
About This Home
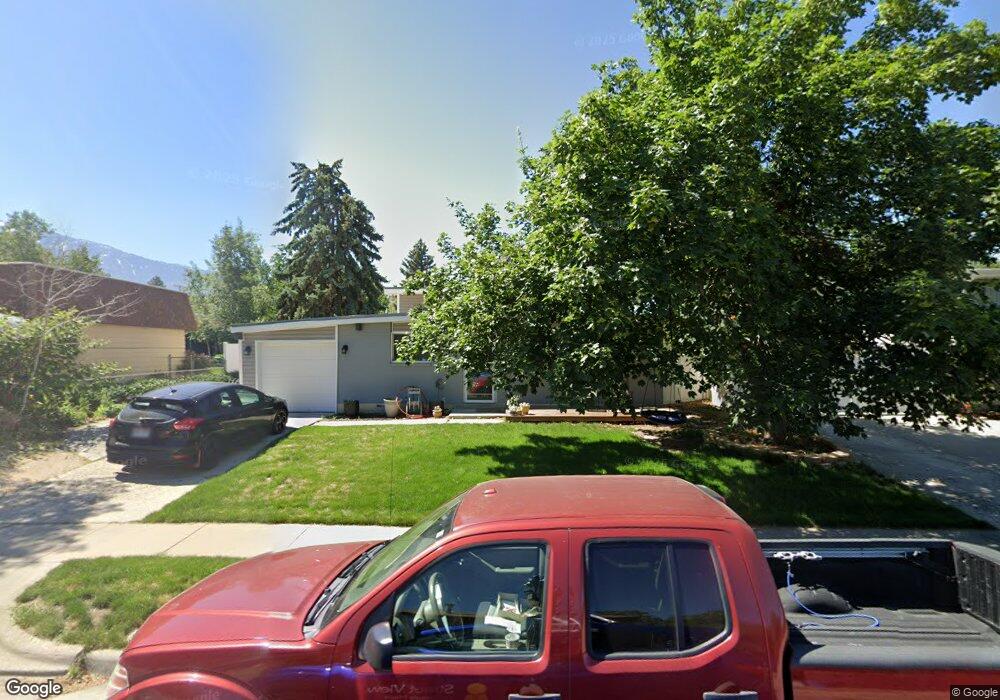
This home is located at 1508 E 8545 S, Sandy, UT 84093 and is currently estimated at $521,939, approximately $522 per square foot. 1508 E 8545 S is a home located in Salt Lake County with nearby schools including Peruvian Park Elementary School, Union Middle School, and Hillcrest High School.
Ownership History
Date
Name
Owned For
Owner Type
Purchase Details
Closed on
Sep 22, 1994
Sold by
Dyches Gerry B and Dyches Heather
Bought by
Espinoza Dean A and Espinoza Tiffany
Current Estimated Value
Home Financials for this Owner
Home Financials are based on the most recent Mortgage that was taken out on this home.
Original Mortgage
$98,940
Interest Rate
7.5%
Mortgage Type
VA
Purchase Details
Closed on
Aug 8, 1994
Sold by
Walker Richard C
Bought by
Dyches Gerry B and Dyches Heather
Home Financials for this Owner
Home Financials are based on the most recent Mortgage that was taken out on this home.
Original Mortgage
$98,940
Interest Rate
7.5%
Mortgage Type
VA
Create a Home Valuation Report for This Property
The Home Valuation Report is an in-depth analysis detailing your home's value as well as a comparison with similar homes in the area
Home Values in the Area
Average Home Value in this Area
Purchase History
| Date | Buyer | Sale Price | Title Company |
|---|---|---|---|
| Espinoza Dean A | -- | -- | |
| Dyches Gerry B | -- | -- |
Source: Public Records
Mortgage History
| Date | Status | Borrower | Loan Amount |
|---|---|---|---|
| Previous Owner | Espinoza Dean A | $98,940 |
Source: Public Records
Tax History
| Year | Tax Paid | Tax Assessment Tax Assessment Total Assessment is a certain percentage of the fair market value that is determined by local assessors to be the total taxable value of land and additions on the property. | Land | Improvement |
|---|---|---|---|---|
| 2025 | $3,088 | $484,600 | $134,000 | $350,600 |
| 2024 | $3,088 | $469,300 | $125,200 | $344,100 |
| 2023 | $3,177 | $472,500 | $119,100 | $353,400 |
| 2022 | $3,025 | $448,100 | $116,800 | $331,300 |
| 2021 | $2,620 | $330,000 | $89,100 | $240,900 |
| 2020 | $2,554 | $303,800 | $89,100 | $214,700 |
| 2019 | $2,322 | $264,100 | $84,100 | $180,000 |
| 2016 | $1,959 | $195,300 | $84,100 | $111,200 |
Source: Public Records
Map
Nearby Homes
- 8492 S Mesa Dr
- 8411 S 1475 E
- 1371 Sudbury Ave
- 1430 E 8685 S
- 1579 E 8730 S
- 8797 S Capella Way
- 8352 S 1330 E
- 1627 E Mulberry Way
- 8638 Piper Ln
- 8857 S Capella Way
- 8642 S Cessna Cir
- 8492 Fayeway Dr
- 8569 Round Stone Cove
- 8569 Round Stone Cove Unit 8
- 8485 S Harvard Park Dr
- 8373 S 1100 E Unit 39
- 8583 S Harvard Park Dr
- 1891 Richard Rd
- 1924 E Viscounti Cove
- 8081 Beaumont Dr
Your Personal Tour Guide
Ask me questions while you tour the home.